
All blogs
Mobile App Development
Ultimate Guide to App Store Analytics Tools
Unlock your app's potential with insights from analytics tools that track performance, user behavior, and market trends effectively.
12 min read
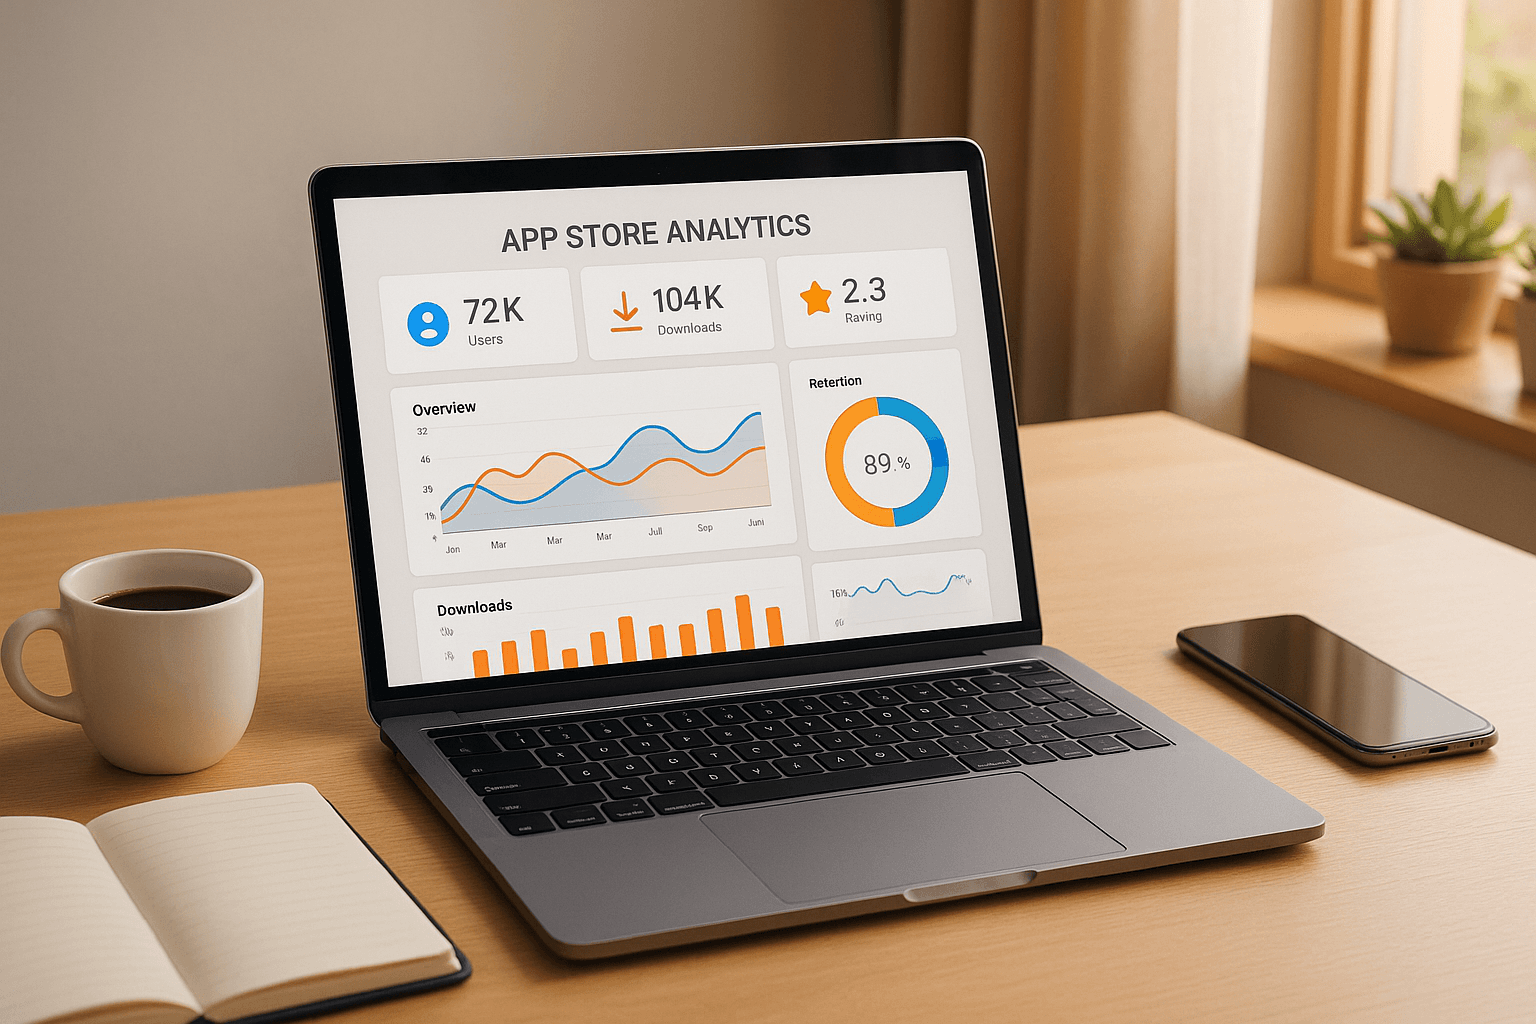
Ultimate Guide to App Store Analytics Tools
Want to improve your app's performance and visibility? App store analytics tools are the way to go. These tools help you track downloads, user behavior, keyword rankings, and even competitor performance, giving you the data needed to make smarter decisions.
Key Takeaways:
- What They Do: App store analytics tools monitor app performance across platforms like Apple's App Store and Google Play.
- Why They Matter: They help optimize user acquisition, engagement, and revenue by identifying trends, improving app listings, and tracking competition.
- Metrics to Watch: Downloads, active users, retention rates, keyword rankings, and revenue metrics like ARPU and LTV.
- Top Tools: Native options like App Store Connect and Google Play Console provide basic insights, while third-party tools like Firebase Analytics, Mixpanel, and Sensor Tower offer deeper analysis.
Quick Tip:
Use multiple tools together for a complete picture - native tools for store data and third-party platforms to track user behavior and advanced metrics.
Let’s explore how these tools can transform your app strategy.
Mobile app analytics best practices: 5 proven tips to track, analyze & grow your app
Key Metrics and Features of App Store Analytics Tools
Understanding the right metrics and features can be the difference between an app that thrives and one that struggles. A well-rounded combination of data points offers a clear picture of your app’s performance, while advanced tools provide deeper insights into how users interact with your app. These metrics set the stage for refining your strategies and improving results.
Important Metrics for Success
Downloads and Installs act as a baseline indicator of your app’s visibility and appeal. While high download numbers show interest, it’s the conversion rates that reveal how effectively you’re turning that interest into action.
Active Users give a much better sense of engagement than downloads alone. Tracking daily active users (DAU) and monthly active users (MAU) helps measure how consistently people use your app. A strong DAU/MAU ratio signals loyalty and regular interaction.
Retention Rates highlight your app’s ability to keep users coming back. Immediate retention, such as the percentage of users who return after the first day, reflects initial satisfaction. Long-term retention offers insight into your app’s ongoing value and user loyalty.
Keyword Rankings directly influence how easily your app can be discovered in search results. Keeping track of your rankings for specific keywords helps you understand how users find your app organically and gives you a chance to improve visibility.
Revenue Metrics like average revenue per user (ARPU), lifetime value (LTV), and conversion rates from free to paid users provide a window into your app’s financial performance. These metrics go beyond downloads to reveal profitability and growth potential.
User Ratings and Reviews carry significant weight in app store rankings and user decisions. Positive feedback not only boosts your app’s reputation but also improves search visibility and conversion rates.
Advanced Features to Look For
Basic metrics are essential, but advanced features unlock deeper insights into user behavior and app performance.
Cohort Analysis groups users based on when they first interacted with your app. This helps you track how different groups behave over time and assess the impact of updates or changes.
User Journey Tracking maps out the complete experience users have within your app, from their first interaction to key milestones like purchases or subscriptions. This can help identify drop-off points and highlight features that drive engagement.
Funnel Analysis focuses on user progression through key processes, such as signing up, onboarding, or completing a purchase. It pinpoints where users may lose interest, allowing you to optimize those stages.
Segmentation Capabilities let you categorize users by factors like demographics, behavior, or acquisition source. These insights can reveal which groups are more engaged or offer higher value over time.
Competitor Benchmarking allows you to compare your app’s performance to others in your category. By analyzing download trends, keyword rankings, and user ratings, you can identify areas where you can improve.
Attribution Tracking connects user acquisitions to specific campaigns, showing which marketing efforts bring in the most valuable users.
Cross-Platform and Real-Time Data
For a complete view of your app’s performance, consider tools that offer real-time updates and cross-platform visibility.
Real-Time Monitoring ensures you can catch trends or issues as they happen, giving you the chance to act quickly - whether it’s capitalizing on a surge in activity or addressing a problem.
Cross-Platform Compatibility lets you track performance across both iOS and Android from a single dashboard, offering a unified view of your app’s reach and impact.
API Integrations link your analytics tools with other systems like marketing platforms, customer support, or financial tools. This provides a comprehensive view of how your app fits into your broader business strategy.
Custom Dashboard Creation allows you to focus on the metrics that matter most. Tailored dashboards ensure your key performance indicators are always front and center.
Historical Data Preservation gives you the ability to analyze long-term trends and patterns. This can be especially useful for planning around seasonal events or industry-specific cycles.
Automated Alerting keeps you informed by sending notifications when key metrics hit specific thresholds. This ensures you’re always ready to respond to new challenges or opportunities.
At Appeneure, we believe in integrating analytics from the start. This approach empowers our clients with immediate access to critical data, helping them make informed decisions that align with market trends and user needs right from day one.
Popular App Store Analytics Tools
When it comes to optimizing your app's performance, choosing the right analytics tool is crucial. From basic built-in tools to advanced third-party platforms, each option offers unique benefits and capabilities.
Native Analytics Tools
App Store Connect is Apple's go-to analytics platform for iOS apps. This free tool provides essential metrics like downloads, revenue, and user engagement - all within Apple's ecosystem. You can track performance across different regions, monitor crash reports, and dive into user reviews. Plus, it offers insights into how users discover your app, whether through specific search terms or category browsing. Its seamless integration with the iOS App Store ensures precise and reliable data.
Google Play Console offers a similar range of features for Android apps, including installs, user ratings, revenue tracking, and crash analytics. One standout feature is its pre-launch reports, which test your app on real devices before release, helping you identify and fix potential issues early. While these native tools provide solid first-party data, they may fall short if you need deeper, more advanced insights.
Third-Party Tools for Advanced Analytics
For a more detailed view of your app's performance, third-party platforms can fill the gaps left by native tools, offering advanced analysis and deeper insights.
- Firebase Analytics: This platform tracks both app store metrics and in-app behavior. Features like event tracking, audience insights, and conversion funnels provide a comprehensive look at user activity. It also integrates smoothly with other Google services and supports tracking up to 500 unique events.
- Mixpanel: Known for its strength in cohort analysis and retention tracking, Mixpanel lets you analyze how different user groups interact with your app over time. Its tools for tracking user actions and creating detailed profiles help you refine and personalize your app experience.
- AppTweak: If App Store Optimization (ASO) is a priority, AppTweak is a strong choice. It monitors keyword rankings, tracks competitor performance, and offers actionable recommendations to improve your app's visibility and discoverability.
- Sensor Tower: This platform provides market intelligence and competitive insights by tracking download estimates, revenue data, and market trends across major app stores. It’s especially useful for benchmarking your app against industry standards.
Most third-party tools operate on subscription models, with pricing based on the features and data volume you need.
Appeneure's App Analytics Solutions
Appeneure takes app analytics to the next level by integrating native and third-party tools into a single, unified performance dashboard. Unlike many solutions that treat analytics as an afterthought, Appeneure incorporates tracking right from the development phase. This ensures that performance data is available as soon as your app launches.
Custom Dashboard Development is a cornerstone of Appeneure's approach. Instead of juggling multiple platforms, clients can access all their data in one streamlined interface. These dashboards are tailored to emphasize the metrics that matter most to your specific business model and industry.
AI-Powered Insights add another layer of sophistication. Appeneure uses artificial intelligence to spot patterns and trends that might otherwise go unnoticed. This includes predictive models for user retention, automated alerts for app issues, and smart recommendations to fine-tune your strategy.
Appeneure also customizes its analytics focus based on the app's purpose. For example, e-commerce apps benefit from detailed conversion tracking, while health tech apps gain insights into user engagement patterns. This ensures that clients receive actionable insights instead of generic data.
Real-Time Monitoring and Alerts keep you informed of key changes in app performance. Whether it’s a sudden surge in downloads, a dip in user ratings, or unusual crash reports, automated alerts help you respond quickly to both challenges and opportunities.
sbb-itb-622dc24
Best Practices for Using App Store Analytics
Turning raw data into meaningful improvements requires a thoughtful approach. These best practices focus on translating key metrics into actionable strategies that drive results.
Set Clear Goals and KPIs
Before diving into analytics, define what success looks like for your app. For revenue-driven apps, focus on metrics like average revenue per user (ARPU), lifetime value (LTV), and conversion rates from free to paid tiers. On the other hand, engagement-focused apps - like games or social platforms - should prioritize daily active users (DAU), session length, and retention rates.
Instead of tracking every available metric, narrow your focus to 3–5 key performance indicators (KPIs) that align with your app’s goals. For example, a fitness app might monitor weekly active users, workout completion rates, and subscription renewals while ignoring less relevant data like download velocity.
Set measurable targets for each KPI to assess progress effectively. For instance, aim to boost 7-day retention from 35% to 45% over three months. This approach allows you to evaluate whether your strategies are delivering results.
Tailor your metrics to different user segments, such as new users, returning users, and premium subscribers. Each group interacts with your app differently and requires unique benchmarks. A dating app, for example, might track profile completion rates for new users, message response rates for active users, and renewal rates for premium members.
Finally, combine data from multiple analytics platforms to gain a comprehensive view of user behavior.
Use Multiple Analytics Tools Together
No single tool can capture the full user journey. A multi-tool approach is essential for tracking both app store performance and in-app engagement.
Combine store analytics and in-app tracking for a complete picture. For example, use App Store Connect to monitor downloads and visibility, then layer on tools like Firebase Analytics to understand how users interact with your app. This provides insights from discovery to engagement.
Cross-referencing data between platforms can uncover opportunities or inconsistencies. For instance, if Google Play Console shows strong install rates but Firebase reveals short session durations, your onboarding process might need improvement. Similarly, if App Store Connect highlights strong organic discovery but poor retention, your app store listing could be attracting the wrong audience.
Consider adding specialized tools for specific needs. ASO (App Store Optimization) platforms can help with keyword strategies and competitor analysis, while user experience tools can identify friction points within your app. The goal isn’t to use every tool available but to build a stack that addresses your app’s critical blind spots.
To make sense of data from multiple sources, consolidate your metrics into a central dashboard. This prevents insights from being lost across different platforms and makes trend analysis more efficient.
Take Action on Data Regularly
Consistent action is key to turning insights into results. Schedule weekly data reviews, assigning team members to monitor specific metrics and flag any significant changes.
Set up automated alerts for critical metrics. For example, if weekly retention falls below 25% or crash rates exceed 2%, trigger immediate audits. Likewise, unexpected spikes in downloads or activity could signal viral content or a successful campaign that you should amplify.
Establish action thresholds to guide your response. For instance, a drop in retention might prompt a user experience review, while a surge in organic downloads could warrant an analysis of what’s driving the growth so it can be replicated.
Keep a log of experiments and results. Documenting optimization efforts, feature launches, and marketing campaigns alongside your data creates a valuable resource for future decision-making. This helps you identify what resonates with your audience and refine your strategies over time.
Respond quickly to user feedback trends visible in your analytics. If ratings take a sudden dip or a key feature sees declining usage, investigate within days - not weeks. Quick responses not only improve user satisfaction but also protect your app’s visibility and rankings, as app store algorithms favor apps with steady positive momentum.
The most successful apps treat analytics as an ongoing dialogue with their users, not just a monthly report. Regularly analyzing data, responding swiftly to trends, and experimenting with improvements create a cycle of continuous growth that builds over time.
Conclusion
After exploring the strategies for app store analytics, one thing is clear: analytics tools aren't just helpful - they're a must for any mobile app business aiming to thrive. By diving into user behavior, keeping an eye on key performance indicators (KPIs), and reacting swiftly to data trends, apps can secure a solid competitive advantage.
Key Takeaways
To get the most out of analytics, combining tools is the way to go. Built-in options like App Store Connect and Google Play Console give you the basics, but third-party platforms can take things further with insights into user behavior, advanced segmentation, and cross-platform tracking.
Real-time monitoring paired with automated alerts is a game-changer. Setting up notifications for critical metrics - such as crash rates, sudden drops in retention, or unexpected download spikes - helps safeguard your app’s rankings and seize growth opportunities when they arise.
That said, it’s easy to get overwhelmed by data. The most successful apps focus on tracking 3-5 KPIs that align with their specific goals. Whether you're zeroing in on user acquisition, boosting engagement, or driving revenue, staying focused ensures your analytics efforts pay off.
Next Steps for Businesses
Start by reviewing your current analytics setup. Many businesses find gaps in their data collection, especially when it comes to mapping user journeys or tracking performance across platforms. Pinpoint the metrics that matter most for your app’s success, then assemble a tool stack that captures those insights effectively.
Begin with native analytics tools, then expand as needed with specialized platforms. The aim is to create a system that grows with your app while staying manageable for your team.
For businesses looking for expert support, companies like Appeneure can help align analytics with your goals right from the start. Their experience across a variety of app categories - from health tech to AI-driven solutions - offers valuable insights into the metrics that lead to success in different markets.
FAQs
How can I combine native and third-party analytics tools to better understand my app's performance?
To fully understand how your app is performing, start with native analytics tools. These built-in tools offer essential data like daily active users, crash reports, and basic engagement stats. They’re easy to access and provide a quick snapshot of your app’s health.
If you want to dig deeper, consider adding third-party analytics tools. These can track user behavior, map out conversion funnels, and analyze retention trends. By integrating them through SDKs or APIs, you can ensure smooth data collection and compatibility with your app.
Using both native and third-party tools together gives you a well-rounded view. You’ll be able to monitor technical performance while uncovering insights to refine your user experience and boost your app’s success.
What’s the difference between basic metrics and advanced features in app store analytics, and how do they influence your app strategy?
Basic metrics such as impressions, downloads, and user engagement offer a quick glimpse into how your app is performing. They highlight general trends and reveal how users are interacting with your app on a surface level.
For a deeper understanding, advanced tools like cohort analysis, retention tracking, and revenue breakdowns come into play. These features help pinpoint specific user behaviors, fine-tune app features, and sharpen marketing strategies. With these insights, you can make data-driven decisions that not only improve your app's visibility but also elevate user satisfaction and increase revenue.
Balancing basic metrics with advanced analytics provides a comprehensive strategy to drive your app's success in a competitive marketplace.
How can app store analytics help me improve user retention and engagement?
App store analytics offers a wealth of insights that can help you improve user retention and engagement. By keeping an eye on metrics like churn rate, session duration, and active user trends, you can uncover patterns in how users interact with your app and spot the moments where engagement tends to drop.
This information is invaluable for fine-tuning your app. You can use it to improve the onboarding process, optimize key features, and create personalized communication strategies that resonate with your audience. Tracking in-app behavior also highlights specific pain points, allowing you to make precise adjustments that encourage users to stick around. Regularly reviewing and acting on these analytics ensures your app evolves in a way that satisfies users and supports long-term growth.
More from the studio