All blogs
Mobile App Development
7 Rich Media Ad Features for Mobile App Engagement
How to pick and measure seven rich media ad formats for mobile apps—metrics, accessibility, testing, and release checklist.
15 min read

7 Rich Media Ad Features for Mobile App Engagement
I’d choose a rich media ad format by the action you want - not the number of taps it gets. Start with one goal, such as an install or purchase, then test the simplest format that supports it.
These seven features give users different ways to interact:
- Tap-to-reveal panels: Show extra details after a tap.
- Swipe galleries: Let users browse products or features.
- Interactive quizzes: Guide users toward a recommendation.
- Sliders: Show comparisons or changes users control.
- Product demos: Let users try a simulated app workflow.
- Playable scenes: Offer a short challenge.
- Expandable units: Open more space for content after a tap.
Quick Comparison
| Feature | Best fit | What I’d measure |
|---|---|---|
| Tap-to-reveal panels | Explaining an offer | Successful reveals and CTA taps |
| Swipe galleries | Browsing options | Cards viewed and product-detail taps |
| Interactive quizzes | Helping users choose | Completions and result CTA taps |
| Sliders | Comparing choices | Value changes and CTA taps |
| Product demos | Showing an app workflow | Steps completed and installs |
| Playable scenes | Letting users try a challenge | Scene completions and installs |
| Expandable units | Providing more detail | Successful expansions and CTA taps |
My rule: interaction is a step, not the outcome. A 50% completion rate means half of starts reached the defined finish - not that half became customers.
I’d plan tracking, accessibility, device tests, and a fallback before building. Then I’d require human approval and compare results against a simpler ad using <u>cost per qualified action</u>, not taps alone.
What are Rich media ads? Tutorial
sbb-itb-622dc24
Define the Campaign Goal and Build Process
Choose one primary outcome before choosing the feature. Keep ad interaction events like quiz_completed separate from app events like sign_up and purchase. Define the denominator, attribution window, and deduplication rules for each rate so repeat interactions don’t inflate results.
Write a brief that covers the audience, placement, CTA, destination, launch date, budget, tracking requirements, and a measurable success threshold. Confirm dimensions, orientation, safe areas, payload limits, media restrictions, and load-time limits with the publisher. Check actual SDK support, especially for expansion and resizing. MRAID standardizes these commands, but support varies by host.
The agent team then maps the interaction, builds the assets, and connects the measurement events. One PM serves as the client contact. A Designer handles interaction states, a Builder handles code and tracking, and a Reviewer checks the logic. QA tests devices, while DevOps handles release after human approval.
Build the format around the interaction, measurement plan, and fallback path. Track work as issues in the client’s own GitHub and accounts, with changes moving through pull requests, code review, and continuous integration (CI).
Testing needs to go beyond the ideal path. Check repeated taps, interrupted sessions, weak connections, orientation changes, and what happens when users return. Human testers run on-device checks alongside the QA agent. Nothing ships until the client approves.
The next sections break down each rich media feature and the actions to measure.
1. Tap-to-Reveal Panels
Interaction and Goal
Start with a compact benefit card, a short headline, and a visible “Tap to reveal” cue. The open panel should provide the promised detail, followed by one clear CTA. This format works for offers that need one extra detail before the CTA. Keep key offer terms visible while the panel is open.
Each tap should trigger one state change and one tracked event.
Agent-Team Build Steps
Build around one deliberate tap and one logged reveal. The PM defines the success event. The Designer creates closed, open, pressed, loading, and error states. The Builder connects a single tap path and logs panel_tap, panel_reveal, panel_close, and cta_tap.
QA checks that one tap produces one reveal and one logged state change.
Engagement and Conversion Metrics
Track valid impressions, reveal taps, successful reveals, closes, CTA taps, and downstream conversions. Calculate reveal rate = reveal taps ÷ valid impressions × 100.
Measure time to first reveal and dwell time separately. Compare CTA taps, successful reveals, and conversions against valid impressions. A high reveal rate alone doesn't prove purchase intent.
Accessibility and Delivery Checks
Give reveal and retract controls accessible names, enough spacing, and visible focus states. WCAG 2.2 sets a minimum target size of 24 × 24 CSS pixels, with exceptions. Support readable text sizes and make sure the open panel fits small screens.
Wait until the tap to load assets that aren't needed upfront. If loading fails, keep the closed card and CTA visible. Don't auto-open the panel.
2. Swipe Galleries
Interaction and Goal
Use a swipe gallery when one panel can’t carry the full message. Show choices, compare features, or walk through use cases. Make the first card a complete ad with the main benefit, branding, product visual, and CTA. Later cards should add detail - not hold back information users need. Show part of the next card or an arrow to make the swipe option clear.
Agent-Team Build Steps
For messages that need more than one screen, the Designer plans the card sequence, swipe cues, and pagination, such as:
“2 of 5.”
The Builder separates swipe gestures from taps, loads the first card immediately, and preloads the next. Assets for later cards wait until needed.
Reviewer and QA agents test partial drags, fast swipes, taps during transitions, rotation, and slow connections. A drag that snaps back must not trigger navigation or count as a completed swipe.
Engagement and Conversion Metrics
Track gallery starts separately from impressions. Then measure completed swipes, unique cards viewed, final-card reach, product-detail taps, and conversions.
Completion rate = starters who reach the final card ÷ gallery starters × 100.
Attach a stable card ID and position to every event to spot where users drop off. Count a view only after it meets the agreed visibility threshold and dwell time - not when the image loads. Differences in card-level conversions show correlation, not causation.
Accessibility and Delivery Checks
Provide labeled Previous and Next controls, and have screen readers announce the current card position. Preserve that position after rotation, respect reduced-motion settings, and keep navigation working if media fails.
Use supported MRAID visibility signals to tell whether an ad has merely loaded or is actually on-screen. Pause animation when the unit is hidden or the app moves to the background. If users need to answer or control the content, use the quiz or slider formats.
3. Interactive Quizzes
Use a quiz when users need help choosing, rather than just another control. Quizzes work well for recommendation-driven campaigns.
Interaction and Goal
Ask three to five short questions that guide users toward a product, plan, feature, or offer. Cut any question that doesn’t change the recommendation. Show progress, and let users see their results without sharing contact details. Use a result-specific CTA:
Try the plan
instead of:
Learn more
Once the decision tree is set, the team builds every answer path and result state.
Agent-Team Build Steps
The PM agent maps the decision tree, minimum data needs, fallback results, and CTA destinations. The Designer creates the question, selection, progress, result, and error states. The Builder adds branching logic, tracking, and Back and reset controls.
The Reviewer and QA agents test every answer path, back navigation, page reloads, reset behavior, invalid states, device sizes, slow connections, and destination flow. A human lead approves the recommendation logic and release candidate before deployment.
Engagement and Conversion Metrics
Track starts, answers, completions, result views, CTA taps, and downstream conversions by question and result ID.
Completion rate = completions ÷ starts × 100.
Question-level drop-off = viewers who leave without answering ÷ question viewers × 100.
Compare CTA taps and conversions with result views. If users finish the quiz but rarely tap the CTA, check the result or next step - not just the quiz itself. Measure the full path from start to result, rather than answer volume alone.
Accessibility and Delivery Checks
Label every answer and its selected state for screen readers. Make sure the question, answer choices, progress, and result are announced in a logical order. Don’t time answers, and keep Back and reset controls clear.
Show the recommendation even if analytics fails. Test interrupted sessions, slow connections, and iOS and Android deep-link fallbacks. Make sure repeated taps don’t send duplicate completion or conversion events.
4. Sliders
Interaction and Goal
Unlike quizzes, sliders show a continuous change rather than a branch. Use them for before-and-after views, price adjustments, or configuration previews - where the interaction itself delivers the message. Show the selected value and its effect right away, with a CTA tied to that choice. Define completion first: an endpoint reached or a configuration confirmed. Measure the value change, not just the drag.
Agent-Team Build Steps
The PM defines the range, completion rule, and CTA. The Designer sets the starting point, milestone values, and labels. The Builder adds touch controls, a tap-to-position fallback, snapping, reset behavior, and milestone events.
The Reviewer checks value mapping and event logic. QA tests iOS and Android devices across screen sizes and orientations. DevOps ships only the approved build.
Engagement and Conversion Metrics
Track starts, milestone reaches, completions based on the rule, resets, and CTA taps. Don’t log every movement. Fire each milestone once per interaction session, and separate explicit resets from backward drags. If the handle starts midrange, record which endpoint each user reveals.
Calculate completion rate as completions ÷ starts × 100. State whether the CTA rate uses starts or completions as its denominator. Compare conversions against a static control. Deep movement without CTA taps suggests the comparison draws attention but may leave the next step unclear.
Accessibility and Delivery Checks
Make dragging optional. Add tap-to-position and step controls that use the same values. Announce the control’s name, current value, minimum, and maximum.
Test movement near screen edges, interrupted gestures, rapid reversals, and accidental CTA activation. Check that before-and-after image layers load correctly and that queued events don’t duplicate after reconnecting.
5. Product Demos
Interaction and Goal
Use a product demo when you need to show how a workflow works. Make it look and behave like the live product without exposing real user flows.
Show one workflow, not the whole app. Guide users from start to result with a few taps or simulated inputs, then offer one install CTA. Label the experience “Demo” so users know it’s a simulation.
Agent-Team Build Steps
The Builder creates simulated controls - no real account creation, payments, or personal-data entry. The Reviewer checks that every step matches the live app and that the demo promises only what the product already does.
Engagement and Conversion Metrics
Track demo starts, completed steps, replays, exits by step, CTA taps, store-page visits, and attributed installs. Keep in-demo events separate from outbound clicks, and report store visits only when tracked.
Calculate step drop-off = exits at a step ÷ users reaching that step × 100.
Early exits point to steps worth checking. If CTA activity is strong but installs are weak, check whether the store page matches the demo’s promise.
Accessibility and Delivery Checks
QA tests interrupted loading, replay, and audio controls. Keep audio off by default, make the demo clear without sound, and keep the exit available during loading.
6. Playable Scenes
Use playable scenes when the ad calls for a short challenge rather than a walkthrough.
Interaction and Goal
Build the challenge around one tutorial prompt, one mechanic, and one end card. Connect the mechanic to a single campaign objective. Before production starts, define what counts as completion: finishing a round, reaching a score, or making a choice.
Count the tutorial as complete when the user finishes their first gesture - not after a set time on the instructions. Give the end card one primary CTA.
Agent-Team Build Steps
The PM defines the mechanic, completion rule, CTA, and acceptance criteria. The Designer creates the tutorial, play area, success and failure states, and end card. The Builder implements the play loop, replay reset, analytics, loading, sound, and CTA destination.
Reviewer and QA test state changes, edge cases, devices, orientation, interruptions, and SDK compatibility. Every role supports the path from the first gesture through gameplay to the end card. Replay should reset the challenge without duplicating start events.
Engagement and Conversion Metrics
Measure whether users finish the scene and continue to the CTA. Track starts, tutorial completions, interactions per session, scene completions, replays, end-card views, CTA taps, and conversions.
Calculate completion rate = completed scenes ÷ playable starts × 100. Report replays separately. Use scene completion to assess engagement and CTA taps to assess intent.
High completion with few end-card views points to a weak handoff. High end-card views with few CTA taps points to an unclear offer or button. Tag scene actions separately from CTA clicks.
Accessibility and Delivery Checks
Test load time, memory, and frame rate on lower-end devices. Check replay, rapid taps, audio interruptions, backgrounding, and the return from the CTA destination. Run these checks across supported iOS and Android versions in the intended ad SDK or MRAID environment.
Use readable prompts, cues that don’t rely on color alone, reduced-motion support, and a reliable exit. Have people test the scene on devices before approval.
7. Expandable Units
After a lightweight challenge, expandable units give users more room to keep interacting.
Interaction and Goal
Use expandable units when a tap should reveal more content rather than trigger a single action. Expand only after an intentional tap. The unit can enlarge the ad container or open an overlay, giving users more space for media, details, or forms.
Agent-Team Build Steps
The PM defines the trigger, size limits, close behavior, and fallback. The Designer creates the collapsed, expanded, and retracted layouts.
The Builder uses MRAID to add expansion behavior: expand() opens the unit, while resize() makes controlled size changes. Wait until MRAID is ready, confirm expansion support, and handle state changes cleanly. Reviewer and QA agents check supported commands and prevent duplicate overlays.
Engagement and Conversion Metrics
Track expand taps, successful expansions, internal interactions, retract taps, CTA taps, and conversions. Calculate expansion rate = expand taps ÷ eligible collapsed impressions × 100. Track tap requests separately from successful expansions so host failures don't get lost in the numbers.
Measure expanded dwell time only while the unit is visible and active. Where possible, exclude time spent in the background or out of view. If users frequently retract the unit right away, check load speed and layout.
Accessibility and Delivery Checks
Test resizing and retraction in the live ad host - not just a browser preview. Check rotation and media interruptions, too. Label the expansion trigger clearly, and keep the close control visible, within reach, and fully onscreen.
Use supported viewability signals. MRAID 3.0’s exposureChange provides a more precise exposure signal than a simple visible/not-visible flag. If the host doesn't support expansion, keep the collapsed state functional rather than showing a broken Expand button.
Next, compare these formats by campaign goal.
Compare Features by Campaign Goal
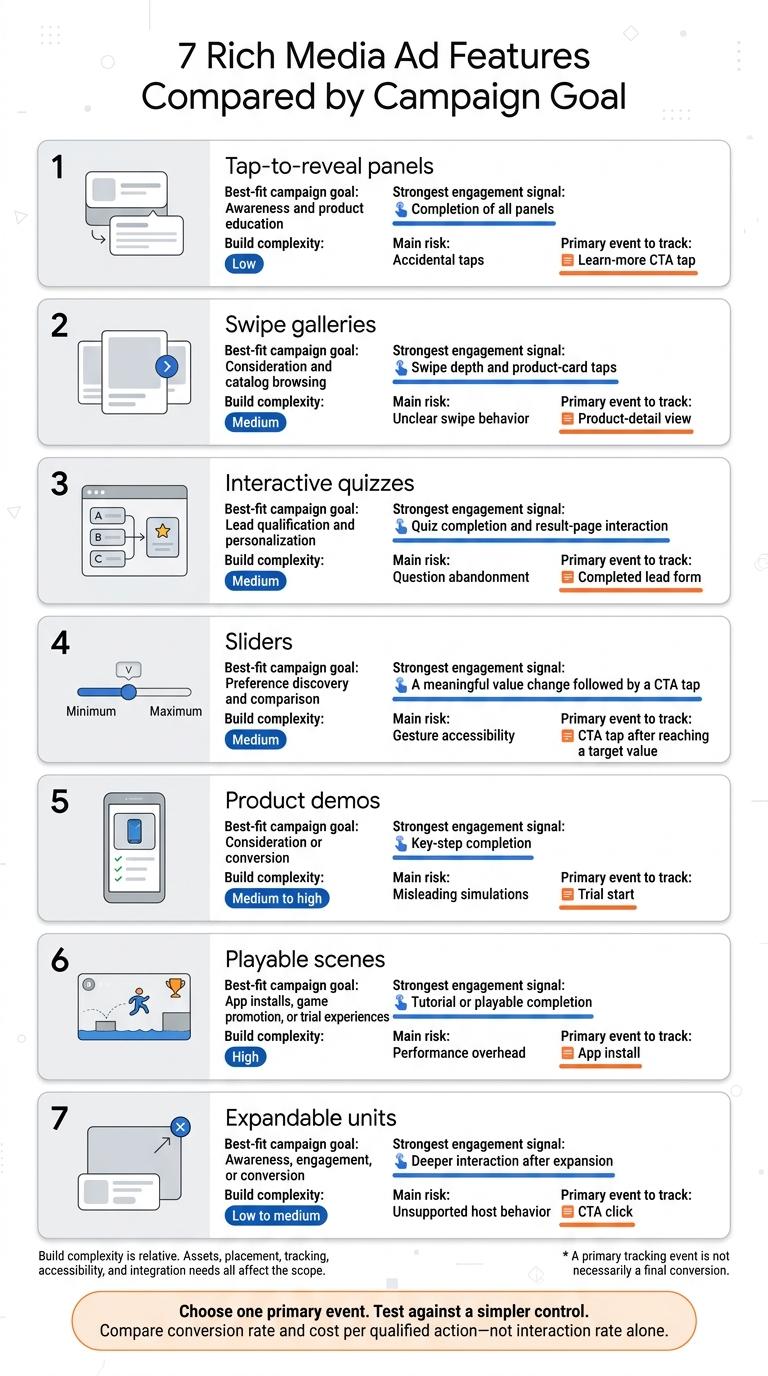
Start with the action you want people to take, then choose the format that supports it. The table separates in-ad engagement from the action your campaign should drive.
| Feature | Best-fit campaign goal | Strongest engagement signal | Build complexity | Main risk | Primary event to track |
|---|---|---|---|---|---|
| Tap-to-reveal panels | Awareness and product education | Completion of all panels | Low | Accidental taps | Learn-more CTA tap |
| Swipe galleries | Consideration and catalog browsing | Swipe depth and product-card taps | Medium | Unclear swipe behavior | Product-detail view |
| Interactive quizzes | Lead qualification and personalization | Quiz completion and result-page interaction | Medium | Question abandonment | Completed lead form |
| Sliders | Preference discovery and comparison | A meaningful value change followed by a CTA tap | Medium | Gesture accessibility | CTA tap after reaching a target value |
| Product demos | Consideration or conversion | Key-step completion | Medium to high | Misleading simulations | Trial start |
| Playable scenes | App installs, game promotion, or trial experiences | Tutorial or playable completion | High | Performance overhead | App install |
| Expandable units | Awareness, engagement, or conversion | Deeper interaction after expansion | Low to medium | Unsupported host behavior | CTA click |
Build complexity is relative. Assets, placement, tracking, accessibility, and integration needs all affect the scope.
Choose one primary event from the table. Then test the format against a simpler control, comparing conversion rate and cost per qualified action - not interaction rate alone. Next, use the checklist to check tracking, accessibility, and readiness for release.
Measurement and Release Checklist
Use the same release gate for every rich media format.
Approve the event dictionary before coding. Record campaign_id, creative_id, ad_version, feature_type, placement, session_id, user_id or a privacy-safe device ID where permitted, timestamp, state_or_step, action, and outcome. Include error, timeout, fallback, mute, replay, and close events. Use event IDs to deduplicate retries.
Separate exposure, engagement, and conversion. Report viewability, engagement, completion, and conversion using each metric’s own denominator. Keep total interactions separate from distinct users, and specify the counting period. Count dwell time ONLY while the ad is ready, visible, and active. Pause the clock when the app is backgrounded, the screen is covered, or the ad is inactive. Exclude loading time and time spent on external pages.
Approve attribution rules and reporting limits. Document which attribution methods are allowed: click-through, view-through, deterministic, aggregated, or modeled. Specify attribution windows, conversion sources, and deduplication rules. Report attributed conversions separately from total conversions, and disclose delayed events, modeling, consent gaps, and cross-device limits. Engagement alone does not prove incremental impact. Causal claims require an approved controlled test with a set duration, minimum sample requirement, confidence method, and stopping rule.
Require delivery and usability checks. Record payload size, asset count, startup time, memory use, network use, and battery impact. Before launch, test loading, failure recovery, interrupted sessions, layout changes, and graceful fallbacks. Check accessibility, audio defaults, and visible close controls, too. Verify data minimization, consent, and opt-outs, and confirm that event payloads contain no unnecessary personal information. Validate MRAID behavior in every target container, including unsupported environments.
Release only after documented approval. Require human review of the measurement plan. Then assign agent work across planning, design, implementation, code review, automated QA, and deployment. Human testers must use real devices to check gesture conflicts, clipping, accessibility, sound, and interrupted sessions. Before release, the client must approve the final build, tracking specification, QA evidence, and rollback plan. Once the checklist passes, move to the feature test plan in the next section.
Choose a Feature and Test Results
Start with the simplest feature that fits the campaign goal, then choose the event you’ll measure. Test that feature against a simpler control in the live mobile placement.
Keep the audience, budget, CTA, and landing page the same. Change one variable so you can isolate its effect and identify the next step. The test should show which outcome drives value - not just which interaction gets attention.
A Finnair swipe-gallery campaign showed why interaction rate alone is not enough: interaction, fare exploration, competition entry, and bookings all told different parts of the story.
Choose winners based on cost per purchase, activation, or retention, not swipe or play volume. If users finish the interaction but don’t convert, revise the result screen, offer, or CTA. Apply the same event logic when judging whether the ad improved qualified outcomes rather than simply generating more interactions.
FAQs
Which rich media feature should I test on a small budget?
Start with banner ads or native ads. Banners stay visible at the top or bottom of the screen and require little development work. Native ads fit your app’s design and keep users engaged, with less custom work than complex interactive units.
Run A/B tests for at least four days, changing only one variable at a time and checking for statistical significance. Use analytics to find the ad placement that works best within your user flow.
How much data do I need to judge an ad test?
Aim for statistically significant results, with at least 1,000 users in each test group. Run your A/B test for at least four days to account for variability.
Some metrics can show results sooner: a winning variation based on clicks may emerge in one to three hours, while revenue data may reach 90% accuracy within one full day. Launch variations at the same time so outside factors, such as seasonal trends, don’t skew the results.
When should I simplify an underperforming interactive ad?
Simplify your interactive ad when data and user feedback show it’s falling short of goals like click-through rates or revenue. Watch for heatmaps showing rage taps or engagement that stays low despite testing.
Change one variable at a time, such as the user flow or call-to-action. This helps you find and fix the bottleneck while keeping the ad easy to use.
More from the studio