
All blogs
AI App Development
Real-Time Data Pipelines for Instant AI Insights
Build one recoverable, measurable real-time event-to-insight workflow before scaling to ensure fast, accurate AI predictions.
9 min read

Real-Time Data Pipelines for Instant AI Insights
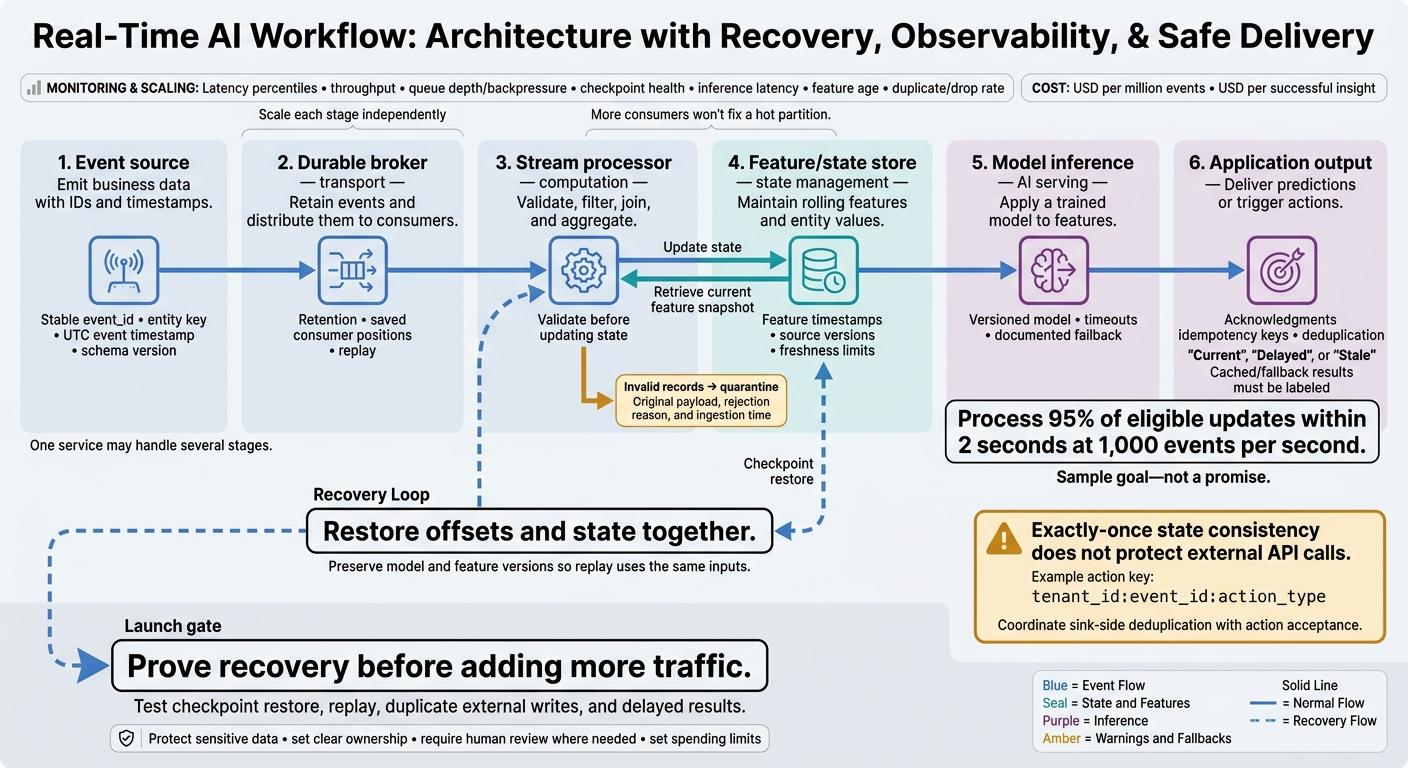
I’d start with one live workflow and a clear target: process 95% of eligible updates within 2 seconds at 1,000 events per second. That’s a sample goal - not a promise. “Instant” means meeting your time limits, not removing every delay.
My approach covers the whole path:
- Choose streaming or batch: Use live data when waiting changes the decision.
- Build the pipeline: Collect and validate events, create features, run the model, and deliver results.
- Plan for failures: Restore state, replay events, and prevent duplicate actions.
- Control delivery and cost: Track delays, data age, model quality, and spending; label cached or fallback results.
- Set clear ownership: Protect sensitive data, require human review where needed, and test recovery before launch.
The rule I’d use: <u>prove recovery before adding more traffic</u>. A fast prediction only helps if it uses the right inputs and reaches your user in time - not after the decision.
Idempotent Data Pipelines | Building Reliable & Fault-Tolerant Data Workflows | Uplatz
sbb-itb-622dc24
How Does a Real-Time AI Pipeline Work?
Events pass through ingest, validation, feature generation, inference, and delivery. Each stage has a separate job, even when one service handles several. A stream processor, for example, can maintain feature state and call a model directly. Keeping these boundaries clear matters because each stage has its own latency, state, and recovery needs.
| Stage | Responsibility | Failure risks | Recovery needs |
|---|---|---|---|
| Event source | Emit business data with IDs and timestamps | Missing, malformed, or duplicate events | Buffering, retries, stable IDs |
| Durable broker - transport | Retain events and distribute them to consumers | Backlog, retention expiry, hot partitions | Replication, saved consumer positions, replay |
| Stream processor - computation | Validate, filter, join, and aggregate | Task failures, incorrect windows, state loss | Checkpoints, deterministic logic, replay |
| Feature/state store - state management | Maintain rolling features and entity values | Stale reads, inconsistent updates | Versioned writes, expiration policies, rebuild procedures |
| Model inference - AI serving | Apply a trained model to features | Timeouts, overload, incompatible inputs | Timeouts, fallbacks, model versioning |
| Application output | Deliver predictions or trigger actions | Disconnection, delayed delivery, duplicate actions | Acknowledgments, idempotency keys, deduplication |
How Are Events Collected and Validated?
Use replayable ingest infrastructure to transport events. Keep prediction logic in the processing and serving layers.
Define an event contract with a stable event_id, entity key, UTC event timestamp, source, schema version, and payload. When order matters, use the entity key as the partition key. Ordering holds only within a partition or shard, and hot keys can limit throughput.
Before updating state, filter out irrelevant event types, normalize field names, units, and currency representation, and check required fields and data types. Quarantine invalid records with their original payload, rejection reason, and ingestion time.
For schema changes, add backward-compatible fields before removing or changing existing ones. Keep historical schema definitions so you can replay older events. Reuse the same event ID on retries so deduplication can tell a repeated delivery from a new event.
With clean, ordered events, the pipeline can start building stateful features.
How Do Events Become Features and Predictions?
Apache Flink supports stateful processing for both bounded data sets and unbounded streams. It builds features through windowed aggregation, joins, and enrichment.
Tumbling windows cover non-overlapping intervals. Sliding windows overlap. Session windows group activity separated by periods of inactivity. Use event timestamps for business windows and watermarks to estimate event-time progress.
Set allowed lateness based on observed delivery delays. Then decide whether late records update features or enter a correction path. For joins, define the key, time relationship, retention period, and what happens when data is missing.
Store feature timestamps and source versions for each feature set, then send the current feature snapshot to a versioned model. Stale enrichment weakens predictions, while slow inference can break latency targets. Define freshness limits, inference timeouts, and fallback behavior separately.
For traceability, attach the event ID, model version, feature timestamp, and prediction timestamp. These separate controls shape the failure and recovery rules in the next section.
How Does a Pipeline Recover Without Corrupting Results?
The event IDs and feature versions used for traceability also help keep recovery safe.
Restore offsets and state together. Replaying without both can produce incorrect windows, counters, or feature values. Plan for durable replay, enough retention, replication across failure domains, recoverable offsets, checkpoints stored outside workers, bounded backpressure, and quarantine paths.
Recovery must restore the same inputs before predictions resume.
How Do Checkpoints and Replay Restore State?
Flink restores the latest completed checkpoint, then replays later events. Kafka Streams rebuilds local state from changelog topics. If local state exists, it resumes from the last checkpointed offset; otherwise, it replays from the earliest retained changelog offset.
Checkpoint recovery must also restore matching feature state. Preserve model and feature versions so replay uses the same inputs. Shorter checkpoint intervals mean less replay work, but they add overhead. Monitor checkpoint age, duration, and failures, not just whether the job is running.
Recovery time depends on state size, disk speed, network throughput, and available capacity. Test both warm restarts and full state loss.
Does Exactly-Once Processing Prevent Duplicate Actions?
No - exactly-once state consistency does not protect external API calls. End-to-end safety requires replayable sources and idempotent or transactional sinks. Use stable action keys at the sink or receiver.
Example action key: tenant_id:event_id:action_typeCoordinate sink-side deduplication with action acceptance. A worker can crash after sending a notification but before recording completion. Without that coordination, replay can send the notification again.
How Should a Pipeline Handle Common Failures?
| Failure | Detection signals | Recovery steps | Data-integrity protection |
|---|---|---|---|
| Broker outage | Unavailable partitions, failed writes, rising lag | Restore replicas and partition ownership; resume gradually | Verify retained offsets; acknowledge writes only after durable acceptance |
| Processor crash | Missing heartbeats, task exits, checkpoint failures | Restart with bounded backoff; restore a valid checkpoint | Restore matching state and offsets; make sink replay safe |
| State-store loss | Missing files, checksum errors, changelog mismatch | Rebuild from checkpoints or changelogs; limit simultaneous restores | Never rely on worker-local storage as the only copy |
| Malformed event | Validation errors | Durably quarantine the record; continue valid traffic | Preserve payload, event ID, schema version, error, and timestamp |
| Model-service timeout | Rising inference latency, circuit-breaker trips | Apply deadlines, bounded retries, backpressure, and a documented fallback | Label fallback results; preserve request identity for recomputation |
Test recovery before launch. Stop processors during state updates and sink writes. Remove local state, interrupt brokers, and throttle inference. Compare recovered outputs with a failure-free run using event IDs, feature values, prediction inputs, and sink records. Measure restore time, lag recovery, quarantine handling, and duplicate actions against documented recovery-time and data-loss limits.
How Do You Scale Pipelines and Deliver App Insights?
Once recovery is defined, scale each stage independently to keep latency predictable. Size ingestion, processing, state storage, inference, and delivery separately. Each stage has different bottlenecks and needs room to handle more load. Scaling protects latency and data freshness - not just traffic capacity.
Which Metrics Reveal Pipeline Bottlenecks?
Track latency percentiles, throughput, queue depth/backpressure, checkpoint health, inference latency, feature age, and duplicate/drop rate. Monitor consumer lag by partition so totals don't hide bottlenecks. Carry one trace ID from ingestion through delivery, and set alerts against the workflow’s latency and freshness targets. Averages can hide slow user experiences.
Add partitions only when key distribution supports it. More consumers won't fix a hot partition. Watch rebalance frequency, and tune polling and batch sizes. Scale inference separately based on queue depth, latency, and concurrency. Use batching or caching where appropriate.
Track infrastructure and inference spending separately in USD, including cost per million events and cost per successful insight. Set monthly budgets, maximum replica counts, and alerts at 50%, 75%, 90%, and 100%. Budget pressure should trigger a preapproved degraded mode - not silently shut down safety-critical work.
How Should Apps Deliver and Handle Delayed Insights?
Once capacity is stable, choose a delivery path based on how soon users need the insight.
| Method | Delivery characteristics |
|---|---|
| Polling API | Repeated HTTP requests; simplest for infrequent checks. |
| WebSockets | Persistent two-way connection for live updates. |
| Server-sent events | One-way HTTP stream with auto-reconnect. |
| Push notifications | Device alerts with variable delivery timing. |
The serving service should return source-event, feature, and prediction timestamps, the model version, and a label showing whether the result is current, delayed, or stale. Define freshness limits for each workflow.
If inference is unavailable, return a labeled cached result or a policy-approved fallback. When a delayed result arrives, compare its sequence number with the latest delivered result and discard older updates.
High-impact health, employment, housing, or financial actions need appropriate human review, policy approval, and an auditable override. These delivery paths also define the security and ownership controls below.
What Security and Ownership Controls Are Needed?
Delivered insights are still sensitive data. Apply the same controls used for upstream events and features.
Encrypt data in transit and at rest. Use least-privilege identities, short-lived credentials, managed secrets, and auditable logs. Collect fewer fields, redact sensitive data, and define retention and deletion rules for events, features, predictions, caches, and backups. Keep code, infrastructure, secrets, model artifacts, and billing under client control.
Coding agents can help build connectors, tests, dashboards, and runbooks. Humans remain accountable for architecture, recovery testing, security review, and release approval.
Small-team launch checklist:
- Ownership
- Alerts
- Deployment gates
- Spending limits
Conclusion: Which Workflow Should You Build First?
Once recovery and scaling are defined, start with one narrow event-to-insight workflow tied to one measurable outcome. Set its trigger, expected result, owner, and fallback before adding sources. Treat data freshness and recovery targets as launch criteria - not guarantees.
Before launch, prove the pipeline can recover cleanly: stop one consumer, restore its checkpoint, and replay retained events. Check for duplicate external writes and record the recovery time. Log model and feature versions, and test what users experience when a result arrives late.
Expand only after recovery is verified and the pilot delivers business value within budget, both under load and during recovery. Add one source, model, or app surface at a time.
For teams that need implementation support, Appeneure can help build, test, and ship the pipeline and app surface under human review, with client-owned repositories and approved releases.
FAQs
How do I set realistic latency targets?
Set latency targets based on user expectations and system limits. For real-time applications, aim for response times under 200 milliseconds to avoid frustrating users.
Track latency, user satisfaction, and conversion rates in performance dashboards to spot when optimization is needed. For AI features where response time matters, consider edge computing or vertical scaling to reduce delays.
How much event history should I retain?
Keep only the event history your predictions need, balancing model accuracy with storage costs. Use data lifecycle policies to automatically move or delete datasets you no longer use.
For long-term user interactions, consider compressing older data into summarized embeddings to keep responses fast. Set clear retention rules that limit stored data to what you need and comply with privacy regulations.
How can I detect declining prediction quality?
Track accuracy, precision, recall, and response time alongside business outcomes, including conversion rates, retention, and user satisfaction.
Use automated MLOps pipelines to detect data drift that could indicate a model is losing relevance. Check quality through unit tests, expert reviews, and A/B testing. Keep results in dashboards, and set alerts for sudden drops so you can step in and retrain models promptly.
More from the studio