All blogs
AI App Development
Real-Time AI Anomaly Detection: App Metrics Pipeline
Telemetry-first pipeline for real-time AI anomaly detection: event-time buckets, delay budgets, independent health checks and alert routing.
6 min read

Real-Time AI Anomaly Detection: App Metrics Pipeline
I treat real-time AI anomaly detection as a timed path from app measurement to delivered alert - not just a model score. I start by setting a delay budget, collecting metrics without slowing app requests, and keeping missing telemetry separate from app failures.
Here’s the approach I use:
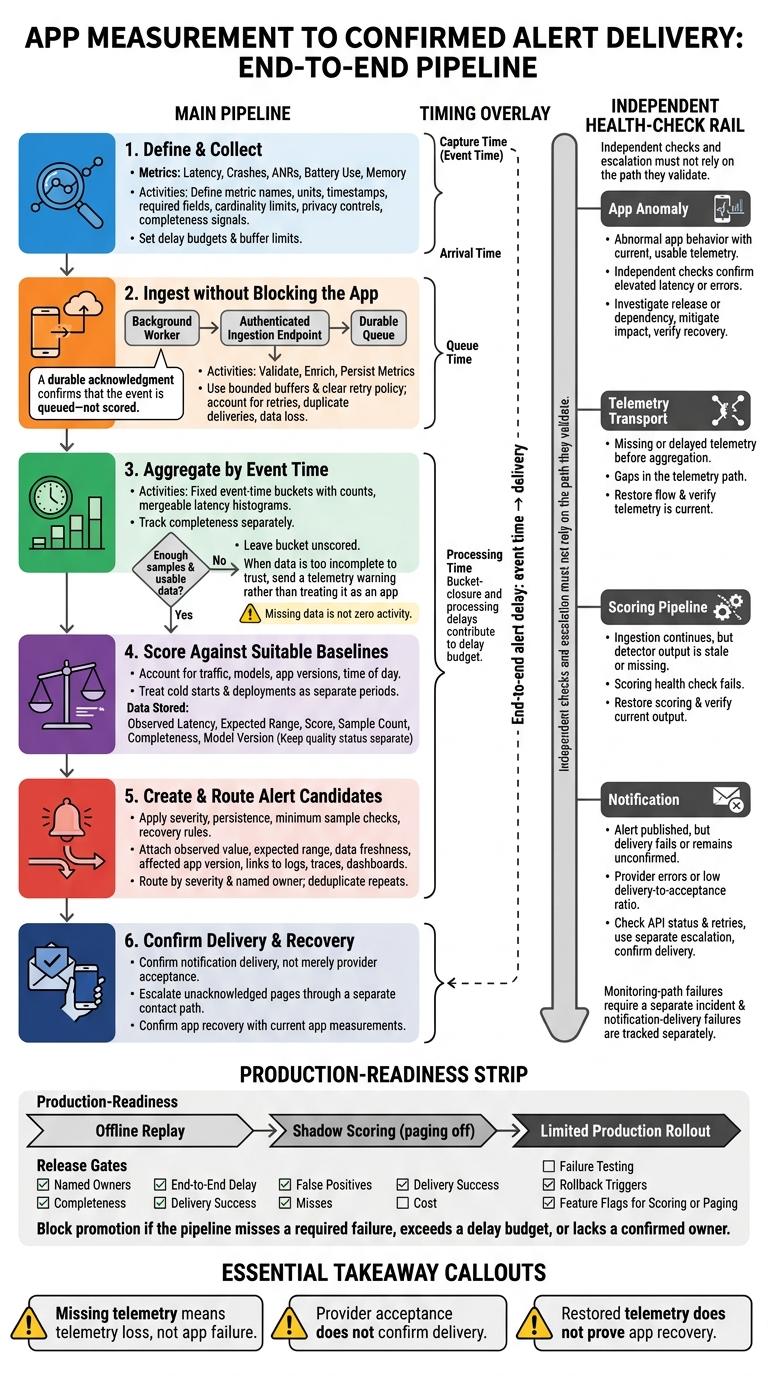
- Define and collect: Set metric names, units, timestamps, and buffer limits for latency, crashes, ANRs, battery use, and memory.
- Ingest and score: Validate events, track delays and data loss, then compare event-time buckets with suitable baselines. Leave low-sample buckets unscored.
- Route and verify: Send alerts with diagnostic context, named owners, and a separate escalation path. Check app health, telemetry, scoring, and notification delivery independently.
- Test before paging: Use replay, shadow scoring, and a limited rollout. Set pass/fail limits for delay, completeness, detection quality, delivery, and cost.
My rule: <u>restored telemetry does not prove app recovery</u>. I confirm recovery with current app measurements - and measure alert delay from event time to delivery.
Architecting Anomaly Detection + Rapid AI Solutions (Apache Pinot, Amazon Bedrock, Kinesis, S3)
sbb-itb-622dc24
Ingest Metrics Without Blocking the App
Send metrics through a background worker to an authenticated ingestion endpoint so app requests never wait on telemetry. A durable acknowledgment confirms that the event is queued - not scored. With delivery off the request path, preserve event time during validation.
Validate Events and Track Processing Delays
Validate, enrich, and persist metrics before aggregation. Track capture time (event time), arrival time, queue time, and processing time in that order. Keep event time, arrival time, and processing delay separate so rules for late data remain explicit.
Manage Backpressure and Track Data Loss
At scale, buffer pressure becomes the main ingestion risk. Use bounded buffers and a clear retry policy, and expect retries and duplicate deliveries. Missing telemetry means telemetry loss, not app failure.
Track crashes, latency, resource usage, and ANRs separately from telemetry delivery.
Aggregate Metrics and Score Anomalies
Build Time Buckets and Handle Missing Data
After ingestion, close validated events into fixed event-time buckets. Group AI request latency observations into these buckets, keeping counts and mergeable histograms.
Track completeness separately, and score only buckets with enough data to support a reliable result. Missing data is not zero activity - keep the two separate, and leave low-sample buckets unscored.
Choose Baselines and Detection Methods
Compare latency against the right baseline so changes in traffic, models, app versions, or time of day don’t look like incidents. Treat cold starts and deployments as separate baseline periods. Scoring should distinguish actual anomalies from normal changes in behavior.
Turn Scores Into Alert Candidates
Store each scored bucket with its observed latency, expected range, score, sample count, completeness, and model version. Keep quality status separate.
Before creating alert candidates, an alerting layer can apply severity, persistence, minimum sample checks, and recovery rules. The scored buckets then feed alert routing. Track bucket-closure and processing delays before paging.
Use the NIST Engineering Statistics Handbook to review statistical assumptions and methods.
Route Alerts and Separate Failure Types
Add Alert Evidence and Route Notifications
When a scored bucket crosses the alert threshold, attach evidence before routing the alert candidate. Include the observed value, expected range, data freshness, affected app version, and links to logs, traces, and dashboards.
Route alerts by severity and owner, deduplicate repeats, and send a telemetry warning when the data is too incomplete to trust.
Check Pipeline Health Independently
Check backend response times, error rates, telemetry transport, and notification delivery separately. Provider acceptance does not confirm delivery.
These independent checks help operators tell app incidents from failures in the monitoring pipeline.
| Failure type | Expected evidence | Operator signals | Response actions |
|---|---|---|---|
| App anomaly | Abnormal app behavior with current, usable telemetry | Independent checks confirm elevated latency or errors | Investigate the release or dependency, mitigate impact, and verify recovery |
| Telemetry transport | Missing or delayed telemetry before aggregation | Gaps in the telemetry path | Check instrumentation and transport, restore flow, and verify that telemetry is current |
| Scoring pipeline | Ingestion continues, but detector output is stale or missing | Scoring health check fails | Restore the scoring pipeline and verify current output |
| Notification | Alert published, but delivery fails or remains unconfirmed | Provider errors or low delivery-to-acceptance ratio | Check API status and retries, use separate escalation, and confirm delivery |
If the monitoring path fails, open a separate incident rather than grouping it with the app incident. Track notification-delivery failures separately, too.
Independent checks and escalation must not rely on the path they validate. If a page goes unacknowledged, escalate through a separate contact path.
Alerting checklist: Confirm ownership, diagnostic links, deduplication, and an independent escalation path. Before closing, verify that telemetry and detector output are current and notification delivery is confirmed. Declare app recovery only when current app evidence confirms it - not just because telemetry is flowing again.
Validate the Pipeline Before Production
Before alerts reach operators, test the full pipeline under failure conditions.
Test Failures Before Enabling Paging
Start with offline replay, shadow scoring, and a limited production rollout. Replay past incidents and synthetic events to test the failure modes you care about. Use chaos engineering, load testing, and stress testing to check how the pipeline handles failures and where it hits capacity limits. Confirm that each test maps to the correct failure class and escalation path.
Run shadow scoring with paging turned off before moving to production. Record completeness, delivery confirmation, false positives, misses, and detection and notification latency. Measure end-to-end delay from the event time, then check each stage against its delay budget.
Begin with a limited production rollout. Use feature flags to turn scoring or paging on or off without releasing a new version.
Assign Owners and Set Release Gates
Before paging goes live, require named owners, release gates, and rollback triggers. Set pass/fail limits for completeness, end-to-end delay, delivery success, false positives, misses, and cost. Block promotion if the pipeline misses a required failure, exceeds a delay budget, or lacks a confirmed owner.
Conclusion: Production Readiness Checklist
Before enabling paging, check that each item is in place.
- Data contract: Define metric names, units, timestamps, required fields, cardinality limits, privacy controls, and completeness signals. Report completeness alongside anomaly scores.
- Timing and resilience: Keep end-to-end delay within its budget. Use backpressure tests to verify buffering, drops, replays, and loss reporting.
- Detection quality: Build baselines that reflect representative app behavior. Calibrate thresholds against known incidents.
- Response path: Verify alert routing and recovery notifications. Assign a named owner and runbook to each failure type. Use independent health checks to distinguish monitoring outages from app failures.
FAQs
How do I set an end-to-end alert delay budget?
Set performance goals that reflect user expectations and industry standards. Run load and stress tests to establish a baseline and pinpoint bottlenecks.
In production, track the time from metric ingestion to alert delivery. Tune anomaly alerts to avoid alert fatigue, and check production data for delays and gaps. Adjust the budget based on user experience and business impact. Keep monitoring failures separate from application failures.
How much data do I need for reliable anomaly detection?
How much data you need depends on the use case. But reliable anomaly detection starts with complete, up-to-date, high-quality data. Before analysis, clean it by removing outliers, correcting labels, and normalizing the data.
Monitor models regularly and retrain them quarterly or annually to keep predictions accurate as your application and user behavior change.
Which metrics should I prioritize when buffers fill up?
Track response times, error rates, and system latency first. These core metrics show system health and user experience, helping you spot service degradation and tell monitoring failures apart from application issues [2].
If backpressure makes data loss unavoidable, keep high-fidelity logs for these metrics ahead of secondary analytical data. That way, you can still diagnose problems under load [2].
More from the studio