
All blogs
Mobile App Development
Ultimate Guide to Mobile App Agile Metrics
Track velocity, cycle time, crash rates, retention, DAU/MAU and performance to improve mobile app delivery and user engagement.
16 min read
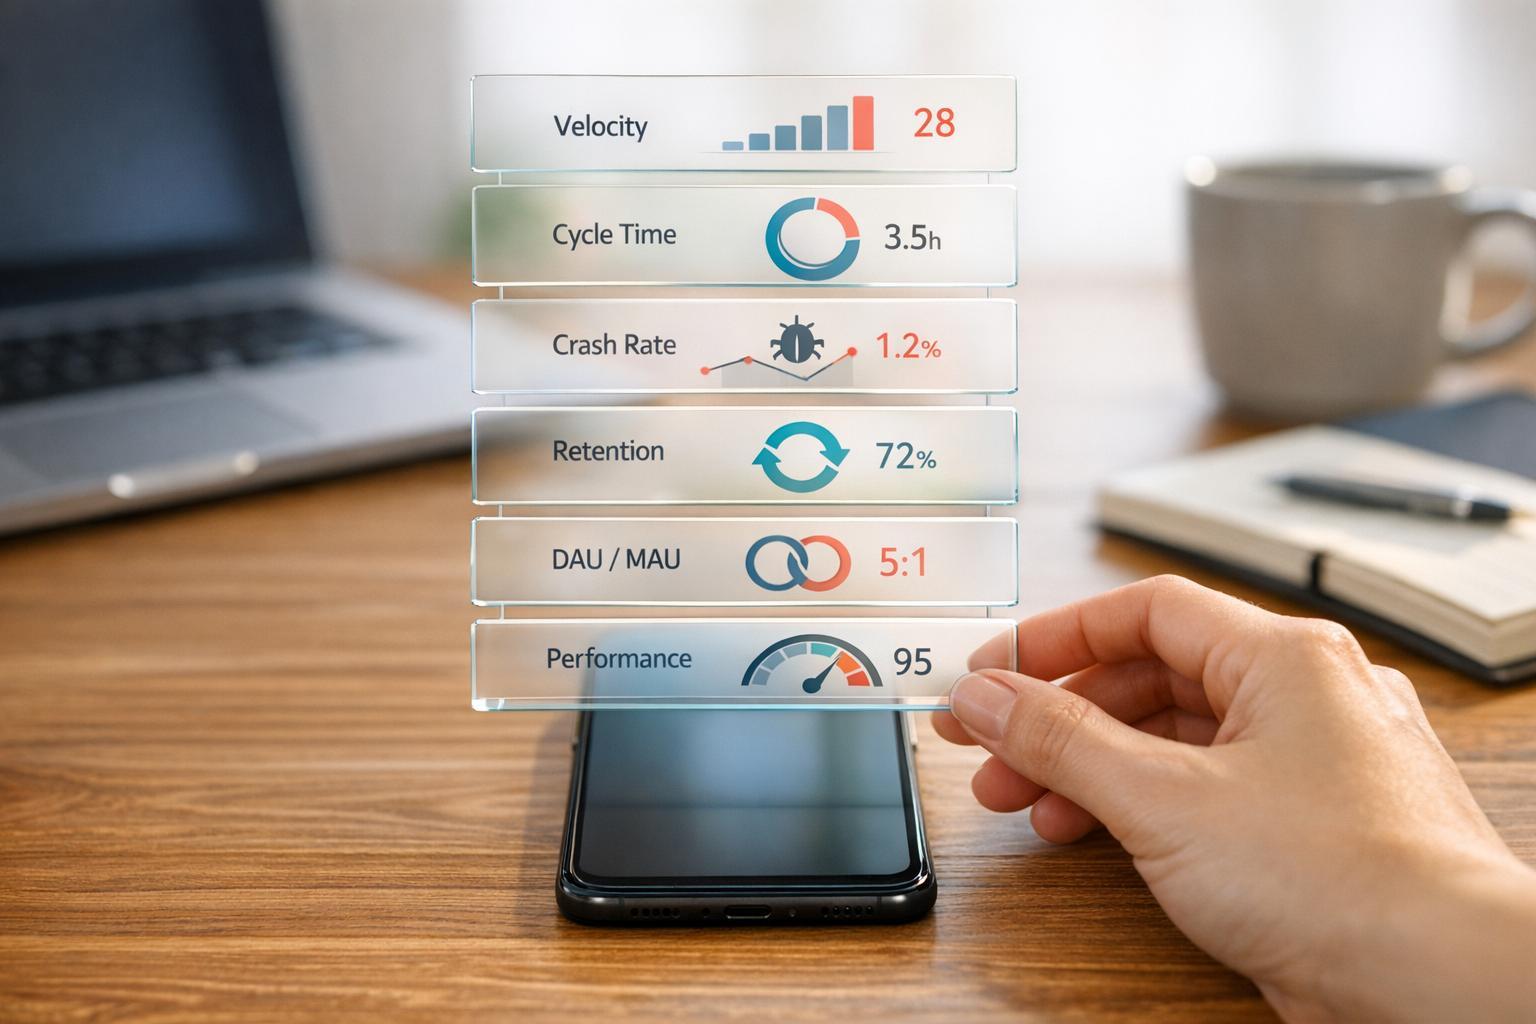
Ultimate Guide to Mobile App Agile Metrics
Agile metrics are essential for mobile app teams aiming to deliver high-quality products efficiently. They help track progress, identify bottlenecks, and improve user satisfaction. This guide covers the most important metrics for development, quality, and user engagement, including:
- Velocity: Measures team predictability by tracking completed story points per sprint.
- Cycle Time: Tracks how long tasks take from start to finish, highlighting delays.
- Crash Rate: Monitors app stability; aim for a crash-free user rate above 99.5%.
- Retention Rates: Measures how many users return; Day 1 retention averages 25%.
- Stickiness Ratio: Daily Active Users (DAU) divided by Monthly Active Users (MAU); a good ratio is 20% or higher.
These metrics provide actionable insights into team performance, app quality, and user engagement. By focusing on key data points, teams can prioritize improvements that matter most to users and the business.
Introduction to Agile Metrics & KPIs: Velocity, Burndown Charts & More!
sbb-itb-622dc24
Core Agile Metrics for Mobile App Teams
Mobile app teams rely on specific metrics to ensure smooth feature delivery and adherence to deadlines. These metrics give you a clear view of your team's workflow, help identify bottlenecks early, and enable better planning. The key is to treat these metrics as planning tools rather than measures to pressure your team. Here are the essential metrics for tracking agile progress in mobile development.
Velocity Tracking in Mobile Sprints
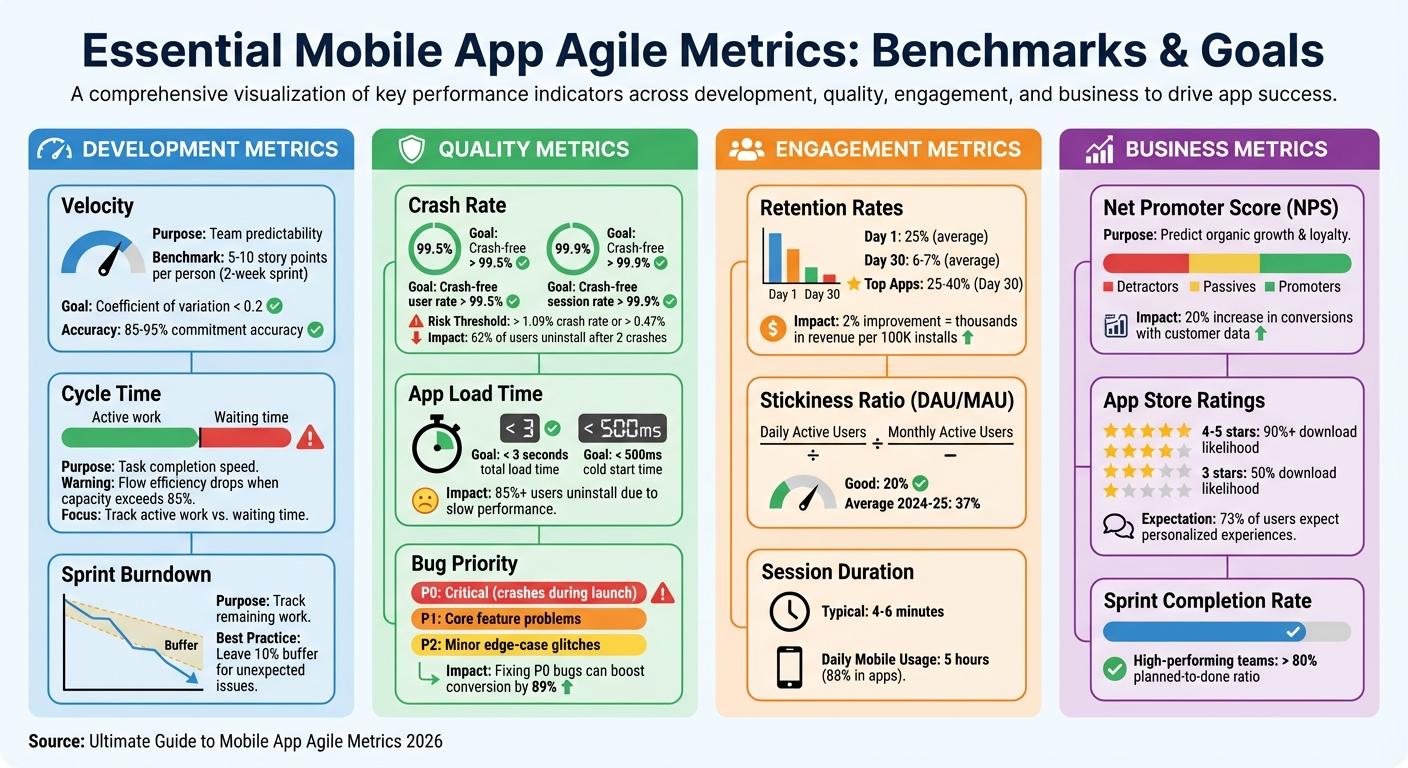
Velocity measures the total story points your team completes during a sprint - but only for work that meets your "Definition of Done." A task that's 90% finished adds zero points, ensuring teams don't manipulate the system. The true value of velocity lies in predictability, not speed. For example, new Scrum teams often average 5–10 story points per person in a two-week sprint. To account for anomalies like holidays or unexpected issues, calculate a rolling average over 3–5 sprints. This consistency helps with strategic release planning in mobile projects. Teams with a consistent velocity (coefficient of variation below 0.2) achieve 85–95% accuracy in meeting their commitments.
"The primary value of velocity isn't speed - it's predictability." - Alice Test, Author
It's important not to compare velocity across teams. Each team defines story points differently, reflecting their specific skills, tools, and project challenges. Organizations that use velocity for team comparisons often see a 34% drop in estimation accuracy within six months. If your velocity declines, it could signal technical debt or team burnout. A sudden spike? That might mean inflated story point estimates.
Sprint Burndown Charts for Feature Delivery
Sprint burndown charts track how much work remains compared to the time left in a sprint. These charts typically measure story points or hours against days. They serve as a guide during daily stand-ups. A flat line on the chart signals an impediment that needs immediate attention. If tasks are added faster than they're completed, you might be facing scope creep or underestimated complexity. To avoid last-minute stress, leave a 10% buffer in your sprint commitments for unexpected issues.
"A daily burndown is an easy, quick, daily graphical representation of how the team is doing against their plan." - Valerie, Author, AgileYammering.com
Review burndown data during retrospectives to understand whether faster progress came from improved workflows or simply avoiding scope creep. Remember, this chart is a team planning tool, not a way to micromanage individual productivity.
Cycle Time for Mobile Development Tasks
Tracking sprint progress is important, but understanding how long individual tasks take is just as crucial. Cycle time measures the duration a task spends "in progress" until it's marked "done". This metric highlights your team's flow efficiency, or the percentage of time spent actively working versus waiting for reviews, approvals, or testing. For example, if your flow efficiency is 20%, tasks are stuck waiting 80% of the time. Breaking down cycle time into active work and waiting periods helps pinpoint delays - whether it's code reviews, QA approvals, or something else. These insights let you address bottlenecks without necessarily adding more resources. Keep in mind that when capacity exceeds 85%, flow efficiency drops, and burnout risks increase.
Combining cycle time with velocity provides deeper insights. If your velocity remains steady but cycle times increase, it could mean your tasks are smaller but harder to complete. This might indicate a need to rethink how you're breaking down features or to address technical debt. Shorter cycle times also improve app quality by enabling more frequent testing and refinement.
Quality Metrics for Mobile Apps
Agile metrics are great for measuring team efficiency, but quality metrics are what ensure your app meets user expectations. While tracking progress is important, the real test lies in how stable and fast your app is - key factors that keep users coming back. Quality metrics act as a reality check, showing whether your app performs reliably across different devices, networks, and user behaviors. These metrics don’t just measure performance - they directly impact revenue, user retention, and your app’s ranking in app stores. Let’s break down how crash rates, bug counts, and load times influence user satisfaction and your bottom line.
Crash Rate Monitoring
Crashes can be a dealbreaker. When an app crashes, users often lose patience and move on. In fact, 62% of users uninstall an app after experiencing just two crashes. Since users rarely report crashes on their own, monitoring tools are essential for catching these issues in real time.
Here’s the goal: aim for a crash-free user rate above 99.5% and a crash-free session rate above 99.9%. Apps with a crash rate higher than 1.09% or an Application Not Responding (ANR) rate above 0.47% risk losing visibility on Google Play. For example, one retailer discovered that ANR problems increased app startup times by 60%, leading to an estimated $6.5 million in annual revenue loss.
To get ahead of crashes, monitoring tools track "breadcrumbs" - detailed logs of user actions, screen transitions, and network requests. These logs help developers reconstruct what led to a crash. By uploading symbol files (like dSYMs for iOS or mapping files for Android), developers can decode memory addresses and pinpoint the exact line of problematic code. Breaking down crash data by device type, OS version, or region can also reveal specific triggers. Real-time alerts for "velocity spikes" (when a crash suddenly impacts a large number of users) allow teams to act fast with rollbacks or hotfixes.
Tracking non-fatal bugs alongside crashes offers even more insight into the overall user experience.
Bug Count After App Launch
Non-fatal bugs might not crash your app, but they still chip away at user trust. Common issues include broken user flows, failed ad loads, or server outages that force users to quit the app.
To manage bugs effectively, categorize them by priority:
- P0: Critical issues like crashes during app launch
- P1: Problems with core features
- P2: Minor edge-case glitches
Focusing on reducing critical (P0) bugs can significantly improve app ratings and even boost conversion rates by as much as 89%. Monitoring critical paths - like login systems or purchase processes - ensures these essential features work without fail. App ratings also matter: over 90% of users are more likely to download apps with 4- or 5-star ratings, compared to just 50% for 3-star apps.
App Load Time and Performance Optimization
Speed is everything in the mobile app world. Over 85% of U.S. users have uninstalled apps due to performance issues like slow load times. To keep users happy, aim for app load times under 3 seconds and cold start times below 500 milliseconds.
Breaking down performance data by user segments can help identify specific problem areas. For instance, high memory usage can trigger Garbage Collection pauses, causing noticeable lag. Testing on physical hardware, particularly on lower-end devices, can uncover bottlenecks that might not show up on high-end models.
Latency is another key factor. When users request data from a server, the response time should ideally be 1 second or less to maintain a smooth experience. To speed things up, consider using CDNs, compressing images, optimizing code, and replacing outdated plugins. Adding progress indicators or loading content dynamically can also help manage user expectations during unavoidable delays.
"You can't improve what you can't track. That's as true in life as it is in mobile app development." - Ivan Trogrlic, Engineering Manager, DECODE
User Engagement and Business Metrics
Quality metrics tell you if your app functions, but engagement metrics show if users actually care. On average, mobile users spend about 5 hours daily on their devices, with 88% of that time spent in apps. This makes engagement data essential for understanding what keeps users coming back - or what drives them away. While quality metrics focus on functionality, engagement metrics reveal the real connection between users and your app.
User Retention and Session Duration
Retention rates track how many users return after their first experience. Industry averages show that only about 25% of users come back after Day 1, and by Day 30, this number drops to just 6–7%. However, top-performing apps can reach retention rates of 25% to 40%. Even a small 2% improvement in Day 30 retention can translate into thousands of dollars in revenue per 100,000 installs.
Session duration measures how much time users spend in your app per visit, typically ranging from 4 to 6 minutes. Improving the onboarding experience can boost long-term retention by up to 50%, making Day 1 retention a critical metric for assessing how well the initial experience communicates the app's value.
For example, Bladestorm used the Pushwoosh Customer Journey Builder to send personalized welcome and reactivation messages. This approach led to a 16.62% increase in monthly active users (MAU) and a 4.58% rise in average revenue per user (ARPU). Similarly, Telepizza leveraged location-based push campaigns to notify customers of nearby offers, achieving conversion rates of 4–7% and generating over $2,400 from a single campaign.
Daily Active Users and Stickiness Ratio
Daily engagement metrics build on retention data to provide deeper insights. Daily Active Users (DAU) measures how many people use your app daily, while the stickiness ratio - calculated by dividing DAU by Monthly Active Users (MAU) - indicates how often users return. A stickiness ratio of 20% is considered good, with the average benchmark for 2024–2025 hovering around 37%. This ratio helps determine whether your app has become part of users' daily routines.
It's important to define "active" by meaningful interactions, such as completing a purchase or engaging with a core feature, rather than simply opening the app. For instance, American Dairy Queen Corporation used Braze to test various welcome offers nationwide, implementing the most effective one based on engagement data. This resulted in a 138% revenue increase compared to their monthly CRM average.
"Improving session frequency and session length are often treated as one, but they require different levers."
– Lorenzo Rossi, Co-founder & Head of Growth, REPLUG
Boosting session frequency often relies on external triggers like push notifications, while extending session length requires improving the in-app experience with personalized feeds and dynamic content. Sephora SEA, for example, used targeted push notifications and in-app video tutorials to promote a new augmented reality makeup feature. This strategy led to a 28% increase in feature adoption and a 48% rise in traffic to the AR tool.
Customer Feedback via NPS and App Store Ratings
Quantitative metrics like DAU and MAU tell you what users are doing, but qualitative feedback explains why. Tools like Net Promoter Score (NPS) and app store ratings offer valuable insights into user satisfaction. High app store ratings not only build trust with potential users but also improve App Store Optimization (ASO), boosting rankings and download rates.
NPS divides users into Promoters, Passives, and Detractors, serving as both a churn warning system and a predictor of organic growth through referrals. Apps that use customer data for decision-making can see up to a 20% increase in conversion rates, and 73% of users expect businesses to understand their individual needs.
Timing is crucial when asking for feedback. Requesting NPS scores or app store ratings immediately after a "value moment" - like completing an order or earning a reward - can capture positive sentiment. NPS scores also allow teams to segment users, targeting Promoters with referral programs and addressing issues with Detractors before they leave. Additionally, monitoring sentiment trends across app store reviews, social media, and support tickets provides a well-rounded view of user satisfaction. Incorporating this feedback into agile development cycles turns insights into actionable improvements.
| Metric | Purpose | Benchmark/Goal |
|---|---|---|
| DAU/MAU Ratio | Measures habit formation and app stickiness | 20% (Good); 37% (Average) |
| Day 1 Retention | Measures onboarding effectiveness | 25% (Average) |
| Session Length | Measures depth of engagement | 4–6 minutes (Typical) |
| Net Promoter Score (NPS) | Predicts organic growth and user loyalty | Varies by industry |
How to Implement and Improve Agile Metrics
You can implement agile metrics using the tools you already have - no need to overhaul your entire workflow. These strategies build on the agile metrics mentioned earlier, helping create a more responsive mobile app development process. For example, platforms like Jira offer built-in reporting features that provide real-time updates on sprint progress, deployment frequency, and cycle time. Modern tools take care of the data collection, letting teams focus on interpreting results instead of manually gathering information.
Before making any changes, it's essential to establish a baseline by collecting data over several sprints. This gives you a solid reference point to measure the impact of adjustments, such as introducing work-in-progress (WIP) limits. With the global market for agile tools projected to reach $9.2 billion by 2024, it's clear that automated tracking is becoming increasingly important. However, relying on technology alone isn’t enough - teams must also use metrics effectively.
Integrating Metrics into Agile Tools
Set up dashboards that make metrics easy to understand for all stakeholders. Define success criteria early by aligning your goals with the overall business strategy before you start tracking. Interestingly, around 75% of technology leaders consider deployment frequency a key metric for measuring DevOps success. For mobile teams, this means tracking how often builds reach internal testing environments, not just final releases to the App Store. Pair this with predictive analytics tools, such as Monte Carlo simulations, to forecast project timelines based on historical data.
"The Value Stream Mapping (VSM) we did has significant value. The team sees what happens, the impact of their actions, and areas for improvement." – Josée Gagnon, Manager, Business Development Bank of Canada
It's crucial to explain the purpose behind metrics to your team. Be transparent about how the data will be used to improve the development process, not to judge individual performance. High-performing agile teams often achieve sprint completion rates (planned-to-done ratio) above 80%. However, hitting this benchmark requires a culture where metrics are used as tools for learning - not as a basis for blame.
Once dashboards are up and success criteria are set, you can start comparing different metric categories for a more complete view of team performance.
Comparing Metric Categories for Better Insights
To get a well-rounded picture, evaluate clusters of metrics that balance speed, quality, and business outcomes. For instance, high productivity (throughput) paired with a low Net Promoter Score might indicate that you're delivering quickly but not providing value. Similarly, fast cycle times combined with high crash rates could mean you're prioritizing speed over quality.
| Metric Category | Core Question Answered | Example Metrics |
|---|---|---|
| Flow (Speed) | How smoothly and quickly is work progressing? | Lead Time, Cycle Time, Throughput, WIP |
| Quality (Stability) | Are we building the right thing and doing it well? | Defect Escape Rate, Code Churn, Crash Rate |
| Business Outcomes (Value) | Does our work matter to customers and the business? | Customer Satisfaction (CSAT), NPS, Feature Adoption Rate |
| Team Health | Is the team working sustainably? | Team Morale, Velocity, Sprint Commitment Accuracy, Turnover Rate |
Assigning ownership of metrics ensures accountability. When someone is responsible for tracking and analyzing data, it’s less likely to be overlooked during busy sprints. For mobile apps, consider segmenting data by acquisition source (organic vs. paid) or user cohorts to uncover real retention and engagement trends. Aggregated data can sometimes be misleading - a 20% retention rate might look good until you realize it’s driven solely by paid users, while organic users churn rapidly.
Continuous Improvement with Retrospectives
Retrospectives are a vital part of refining your agile process. Use metrics during these sessions to review charts like Cumulative Flow Diagrams or Velocity, celebrating wins and identifying areas for improvement. After each sprint, compare Planned-to-Done ratios to spot workflow inefficiencies.
"A decrease in average velocity is usually a sign that some part of the team's development process has become inefficient and should be brought up at the next retrospective." – Atlassian
Visual tools like burndown charts can help identify red flags. For example, steep drops may indicate that tasks aren’t broken down enough, while flat lines could signal bottlenecks. Monitoring "Work Item Age" (the time tasks spend in progress) can help catch delays before they derail deadlines.
Start small to avoid overwhelming your team. Focus on one or two core metrics, like Cycle Time and WIP, to create a manageable feedback loop. As your team becomes more comfortable, you can gradually introduce more complexity. Agile adoption among engineering and R&D teams increased to 48% in 2023, up 16% from the previous year, showing that success often comes from patience and incremental changes.
"Never, ever use velocity to compare two different teams. Team A's '10 points' could be a mountain of work, while Team B's '10 points' might be a molehill." – Zest
To improve Cycle Time, consider implementing WIP limits. This reduces context switching and clears bottlenecks. For teams using AI coding assistants, track new metrics like "AI Time Saved" (measuring hours saved by automating repetitive tasks) and "Prompt Effectiveness" (evaluating the quality of human-AI interactions). These metrics are becoming increasingly relevant as development workflows evolve.
At Appeneure, we incorporate these agile practices to continuously refine our processes and deliver user-focused, high-quality mobile applications.
Conclusion
Agile metrics have grown into powerful tools that do much more than track delivery - they help organizations understand how well their systems turn ideas into meaningful outcomes for customers. In 2026, thriving companies are shifting their focus from simply asking, "Are teams delivering?" to the deeper question, "Is the system getting better?"
Success hinges on balancing four key areas: delivery speed, quality, flow efficiency, and team health. High-performing teams know that prioritizing speed at the expense of quality or team well-being can destabilize the entire system. Research has shown that issues like early abandonment and high uninstall rates highlight the importance of quality metrics alongside delivery speed.
As NextAgile puts it:
"Agility matures when organizations stop asking 'Are teams delivering?' and start asking 'Is the system improving?'" - NextAgile
To get started, adopt a Health Pulse approach by focusing on foundational metrics like Cycle Time, Throughput, and Defect Escape Rate before diving into more advanced data. Keep in mind that a staggering 73% of enterprise data often goes unused, so it's better to prioritize the most meaningful metrics rather than overwhelming yourself with dashboards. Set practical thresholds - such as a ±30% variance in velocity or capacity utilization consistently above 85% - to identify and address issues early.
At Appeneure, we've seen firsthand how treating agile metrics as learning tools, rather than strict performance measures, bridges the gap between leadership goals and team execution. Whether you're working on AI-driven apps or more traditional mobile solutions, using metrics as a way to learn and adapt ensures your development process stays aligned with what users genuinely value. This mindset not only strengthens agility but also leads to apps that resonate with users and meet their needs.
FAQs
Which 2–3 agile metrics should a mobile app team start tracking first?
If you're just starting to explore agile metrics for your mobile app team, focus on three essential ones: user retention, daily active users (DAU), and user engagement.
- User retention measures how well your app keeps users coming back over time. It's a clear indicator of long-term satisfaction and loyalty.
- Daily active users (DAU) highlights how many people are actively using your app each day, offering a snapshot of daily activity and overall popularity.
- User engagement dives deeper into how users interact with your app. This includes metrics like session length or how often specific features are used. Understanding these patterns helps you refine the user experience and improve retention rates.
By keeping an eye on these metrics, your team can identify what’s working and where to make adjustments for better results.
How can we use velocity without turning it into a performance metric?
Velocity serves best as a planning tool to estimate a team's work capacity rather than a metric for measuring productivity. The key is to monitor its consistency over time, which helps in setting realistic plans and identifying areas for process improvement. It's important to resist the temptation to compare velocity across teams or push for higher numbers, as this can negatively impact the quality of work. Instead, pair velocity with qualitative feedback to promote sustainable development and ensure the focus stays on delivering value. This approach encourages collaboration and maintains a healthy team dynamic.
What’s the fastest way to connect crash rate and retention changes to recent releases?
To connect changes in crash rates and retention to new releases effectively, leverage analytics tools to monitor these metrics in real time. Start by establishing a baseline before the release, then analyze the data after deployment for any shifts. Automated alerts can be a game-changer, notifying your team of sudden increases in crashes or declines in retention, enabling quicker responses. Keeping an eye on Day-1 retention and trends in the following days offers timely feedback on user experience and app performance.
More from the studio