
All blogs
AI App Development
AI App Latency: Model Serving Bottlenecks and Fixes
Trace full requests, isolate app vs. serving delays, and fix measured bottlenecks to reduce tail latency.
13 min read

AI App Latency: Model Serving Bottlenecks and Fixes
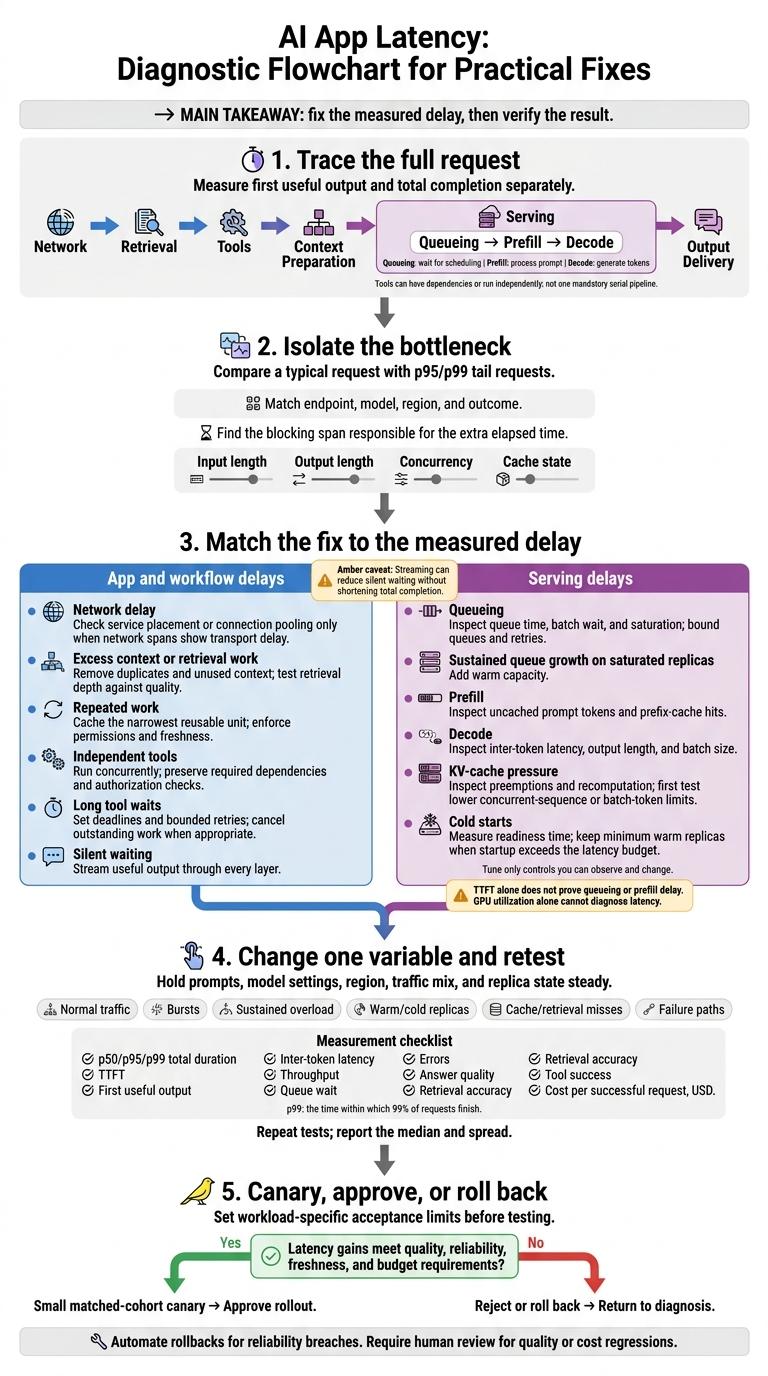
Before I change models or buy more capacity, I trace where the request spends its time. I measure two things: when you see the first useful output and when all required work finishes.
Then I match the fix to the delay:
- App delays: Cut unused context, cache repeated work, run independent tools together, and limit retries.
- Serving delays: Separate queue waits, prompt processing, and token generation before tuning batches, KV cache, or capacity.
- Silent waiting: Stream useful output - but don’t mistake an earlier first token for a shorter total wait.
I check p50, p95, and p99, not just averages. A p99 measurement shows the time within which 99% of requests finish. Before rollout, I test under load and compare answer quality, errors, and cost per successful request.
My rule: <u>fix the measured delay, then verify the result.</u>
Tour De Force: LLM Inference Optimization From Simple To Sophisticated - Christin Pohl, Microsoft
sbb-itb-622dc24
Find the Bottleneck Before Scaling
Use the trace from the previous section to compare a typical request with the slowest tail requests. Match a median request against a p95/p99 request from the same endpoint, model, region, and outcome. Find the blocking span that accounts for the extra elapsed time. Then test one variable at a time.
| Variable | Latency signal | Keep constant |
|---|---|---|
| Input length | More uncached input tokens increase prefill time and KV-cache pressure. | Input-token range, prompt template, retrieved-document count |
| Output length | More generated tokens generally increase decode duration. | Maximum output tokens, stop conditions, answer type |
| Concurrency | Higher load can increase queueing, batch waits, and cache pressure. | Concurrent requests or arrival rate |
| Cache state | Hits can skip retrieval work or repeated prompt computation. | Retrieval-cache state, prompt-prefix state, KV-cache state |
If the extra time falls outside serving, check the network, retrieval, and tools.
Check Network, Retrieval, and Tool Delays
Locate the delay before blaming inference. Check client timing and backend spans, then break retrieval and tool chains into substeps.
| Symptom | Supporting data | Likely causes to investigate |
|---|---|---|
| Slow requests cluster by location | DNS, connection, and TLS timing; client/server regions; payload bytes | Connection setup, long geographic routes, cross-region traffic |
| Long delay before backend work starts | Client upload timing, gateway logs, request size | Upload delay, proxy buffering, gateway queue |
| Retrieval accounts for most of the wait | Separate embedding, search, and reranking durations; candidate count | Slow embedding generation, expensive search, large reranking workload |
| Search finishes quickly, but model submission waits | Context-assembly time, document count, serialization and tokenization time | Duplicate documents, oversized context, CPU-bound preparation |
| Tools account for most of the completion time | Dependency graph, per-attempt duration, timeout status, retry backoff | Serial dependencies, downstream saturation, rate limits |
| Model finishes before the client receives output | Server emission and client arrival timestamps | Response buffering, serialization, network delivery |
If the delay falls inside serving, break it down into queueing, prefill, and decode.
Separate Queueing, Prefill, and Decode Delays
Follow the serving engine’s boundaries: queueing is the wait for scheduling, prefill processes the prompt, and decode generates tokens. Check whether each metric includes scheduling or batch waits. When available, separate queue, prefill, and decode histograms let you test each stage directly.
| Stage or condition | Symptom | Measurements to inspect | Diagnostic limit |
|---|---|---|---|
| Queueing | TTFT rises with load; token delivery afterward stays similar | Queue depth/time, admission rejections, batch wait, per-replica saturation | Hosted APIs may hide scheduler timing |
| Prefill | First-token delay grows with prompt length despite short queues | Prefill duration, uncached prompt tokens, prefix-cache hits, batch composition | TTFT can also include routing and other provider-side work |
| Decode | Tokens arrive slowly after generation starts | Inter-token latency, output length, decode duration, batch size | Client buffering can look like slow generation |
| KV-cache pressure | Irregular stalls as concurrency rises | Cache utilization, preemptions, rescheduling, swap or recomputation events | GPU memory usage alone does not show logical cache exhaustion |
| Cold start | First request to a replica is unusually slow | Replica lifecycle, model loading, initialization, first-request timing | Provider telemetry may not expose these events |
Without internal spans, high TTFT paired with normal inter-token latency suggests waiting or prompt processing - but proves neither. Normal TTFT with slow token delivery points toward decode or delivery delays.
GPU utilization alone cannot diagnose latency. Low utilization can occur during upstream waits. High utilization can accompany either healthy throughput or poor tail latency. Treat capacity as the cause only when load tests tie the delay to serving saturation, rather than input length, cache misses, or downstream work.
Reduce App and Workflow Delays
If the bottleneck sits outside inference - queueing, prefill, and decode - remove unnecessary work before tuning serving capacity.
Stream Output and Limit Tool Work
Streaming cuts silent waiting, but it doesn't always shorten completion time. Measure first useful output separately from TTFT and final completion.
Stream through every layer: provider, server, proxy, moderation, and client. Test slow networks, truncated output, and disconnect handling.
Run independent tools concurrently. Keep required dependencies and authorization checks serial. Merge adjacent steps only when they don't need separate authorization or outputs, and keep deterministic logic in application code.
Give each tool a deadline and a retry limit that fit within the total request deadline. Label missing or stale data in fallbacks. Cancel outstanding work when the client disconnects or the request deadline expires.
Once you've removed avoidable workflow waits, shrink the request itself.
Trim Context and Cache Repeated Work
Set token budgets for instructions, history, retrieved passages, tool schemas, and output length. Remove duplicates and unused definitions. Put stable prompt content before dynamic content to maximize prefix reuse.
Test top-k, chunk size, and rerank depth separately. Check each against answer accuracy, recall, groundedness, and citation coverage.
Change service placement or connection pooling only when network spans show transport delay. Move preprocessing off the request path only if you can still verify data freshness and authorization.
Cache the narrowest reusable unit to avoid repeating request work. Every cache must enforce permissions and data freshness.
| Cache | Reused work | Latency benefit | Invalidation needs | Correctness risk |
|---|---|---|---|---|
| Exact response | Answer for identical inputs | Bypasses retrieval and inference | Source, permission, prompt, or model changes | Stale or cross-tenant output |
| Prompt prefix | Stable-prefix computation | Reduces prefill and TTFT | Prefix, model, routing, or lifetime changes | Dynamic-data reuse |
| Retrieval | Search results or reranked passages | Skips search or reranking | Document, ACL, index, or filter changes | Missing evidence or restricted-content exposure |
| Embedding | Vector for repeated text | Skips embedding generation | Text, normalization, model, or dimension changes | Incompatible vectors |
| Semantic | Result for a similar query | Bypasses repeated processing | Source/model versions, expiration, invalidation | False matches, stale output, cross-user leakage |
Track hit rate, miss latency, stale-hit rate, eviction rate, and cache age. Include the relevant tenant, authorization scope, locale, retrieval filters, and source/model/prompt versions in cache keys.
Test permission revocation and document updates. A high hit rate doesn't prove reuse is safe.
Test each app-level fix against the same latency and quality metrics.
Compare App Fixes and Tradeoffs
Choose the change that addresses the bottleneck you've measured.
| Change | Metric affected | How it helps | Implementation risk | Quality or freshness tradeoff |
|---|---|---|---|---|
| Streaming | First useful output, perceived waiting | Exposes usable output earlier | Proxy buffering, truncated output, disconnects, moderation complexity | Incomplete or revised text |
| Parallel execution | Workflow elapsed time | Overlaps independent steps | Race conditions, rate limits, burst load | Inconsistent results |
| Caching | TTFT, elapsed time, compute cost | Skips repeated processing | Bad keys, invalidation, isolation failures | Stale or mismatched output |
| Context reduction | Prefill time, input tokens | Removes unnecessary input | Lost instructions or evidence | Weaker grounding |
| Retrieval reduction | Search, reranking, prefill time | Processes fewer candidates | Overly narrow retrieval | Lower recall and citation coverage |
| Tool timeouts | Tail latency, reliability | Bounds dependency waits | Partial results, fallback complexity | Missing current or specialized information |
Compare changes using the same workload, including warm and cold caches, long prompts, slow tools, and cancellations. Record p50, p95, and p99 for TTFT and end-to-end completion, alongside token usage, cost, errors, answer quality, and freshness. Accept a change only when its measured gains meet correctness requirements.
Tune Serving for Measured Bottlenecks
When traces point to queue wait, slow prefill or decode, or KV-cache pressure, tune the scheduler, batcher, or cache - not the app path. Break down measurements by replica, prompt length, and traffic class.
Work with the controls you can observe and change. Don’t try to tune hidden internals.
| Control or metric | Managed inference APIs | With infrastructure access |
|---|---|---|
| Model, output-token limit, streaming | Commonly available | Configurable |
| Request concurrency and rate limits | Often partly configurable | Gateway and scheduler controls |
| Queue depth, wait limits, admission control | Often hidden or summarized | Usually configurable and observable |
| Continuous batching, batch-token and sequence limits | Usually provider-controlled | Configurable in supported runtimes |
| KV-cache allocation and preemptions | Rarely exposed | Runtime-dependent controls and metrics |
| Warm replicas, kernels, compilation | Plan- or deployment-dependent | Direct control, subject to runtime support |
Start with the smallest serving change that addresses the measured bottleneck.
Balance Queues, Batches, and Capacity
Bound the queue before increasing concurrency. Set the queue-wait cap below the request deadline, then reject, degrade, or downgrade overflow. Use backoff with jitter and bounded retries. Don’t resubmit accepted work without idempotency guarantees.
Tune batch-token and concurrent-sequence limits together. The first caps scheduled token work; the second caps active sequences and their cache demand.
Continuous batching admits and retires requests between decode steps. This improves utilization but often increases per-request latency. Before relying on autoscaling, measure how long replicas take to become ready, including model loading and initialization.
| Measured bottleneck | Least disruptive first fix | Latency tradeoff | Throughput and cost tradeoff |
|---|---|---|---|
| Brief backlog spikes; warm replicas recover | Bounded backlog-based scaling and admission control | Startup delay remains | More burst capacity; added burst spend |
| Sustained queue growth on saturated replicas | Add warm capacity | Reduces queue wait | More throughput; higher baseline cost |
| Static batches leave execution slots idle | Test continuous batching | Excessive batching can increase TTFT | Better utilization may lower unit cost |
| Batch-fill waiting dominates TTFT | Reduce maximum batch wait | Earlier execution | Smaller batches may reduce efficiency |
| Full batches slow active streams | Lower sequence or batch-token caps | Better streaming and tail latency | Per-replica throughput may fall |
| Replica startup exceeds the latency budget | Keep minimum warm replicas; scale earlier on queue age | Avoids cold-start waiting | Pays for idle capacity |
| Failures trigger repeated retries | Admission control and bounded retries | Some requests fail sooner | Protects useful throughput and avoids duplicate cost |
Test the queue policy under realistic load before increasing concurrency. If queue wait stays stable but latency keeps climbing, check the cache or execution path next.
Manage KV Cache and Model Execution
Track KV-cache occupancy, allocation failures, preemptions, recomputation, and headroom. Frequent preemptions can mean active requests no longer fit in cache. First, test lower concurrent-sequence or batch-token limits. Increase cache allocation only after leaving room for weights and runtime buffers.
Cache-aware routing also needs a load guard. Send work elsewhere when the preferred replica’s queue or cache pressure exceeds its threshold.
| Change | Bottleneck addressed | Prerequisites and compatibility checks | Quality or operational risk | Measure on your workload |
|---|---|---|---|---|
| Lower sequence or batch-token caps | Cache pressure, preemptions | Runtime-specific token accounting | Lower capacity; longer queues | Preemptions, queue wait, completed requests/second |
| Cache-aware routing | Repeated prefix computation | Prefix identity, load-aware fallback | Hot replicas and uneven load | Hit rate, per-replica queue, p99 latency |
| Chunked prefill | Long prompts interrupting decode | Scheduler support | Long prompts may finish later | Inter-token latency and TTFT |
| Runtime or compilation profiles | Execution overhead | Supported shapes, operators, warmed profiles | Compilation delays or slower fallback paths | Warm-up time, fallback frequency, steady-state latency |
| Quantization | Weight memory and compute | Model, datatype, kernel, and hardware support | Accuracy or numerical stability loss | Memory, task quality, tokens/second, p95 latency |
| Optimized attention | Prefill and decode execution | GPU, datatype, sequence-length support | Unsupported shapes or numerical differences | Prefill, decode, and tail latency |
| Speculative decoding | Decode time | Compatible draft/target models and runtime | Extra memory; poor acceptance reduces benefit | Accepted draft tokens, quality equivalence, latency |
| Smaller-model routing | Compute demand and queueing | Task-specific routing and fallback | Accuracy loss or costly escalations | Quality by task, escalation rate, cost, latency |
Match batch settings to the runtime’s preferred shapes and warm each deployment profile. Measure cold starts separately from steady-state performance. Keep interactive traffic separate from asynchronous batch policies when their latency needs conflict. Accept execution changes only when workload p95 or p99 improves without quality loss.
Test Fixes and Control Tail Latency
Trace, isolate, change, retest. Hold prompts, model settings, region, traffic mix, and replica state steady. Change only the variable you're testing. Before accepting a change, compare latency, quality, errors, and cost - not just average response time.
Test Realistic Loads and Failure Paths
Once you've applied a fix, test it against the traffic that exposed the bottleneck.
Record p50/p95/p99 total duration, TTFT, inter-token latency, throughput, queue wait time, errors, and cost per successful request in USD. Replay realistic prompt and output lengths under normal traffic, bursts, and sustained overload. Measure warm and cold replicas separately, and include cache and retrieval misses. Use arrival-rate tests that ramp up request volume to reveal queues that grow under load.
Test tool timeouts, malformed results, dropped streams, cancellation, and retries. Check whether recovery finishes useful work or doubles the model's work. Pair every run with checks for answer quality, retrieval accuracy, and tool success. Repeat each test and report the median and spread. One fast run proves nothing.
Roll Out Changes With Human Approval
Set targets for each workload. Interactive features need responsive results. Background jobs need reliable completion and affordable throughput. Agent workflows need step deadlines, successful tool calls, and visible progress.
Compare matched workload cohorts in a small canary rollout. Set acceptance limits before testing, then fill the scorecard with measured results. Use the same acceptance sheet for every candidate change.
| Metric | Baseline | Candidate | Acceptance threshold |
|---|---|---|---|
| p50/p95/p99 duration; TTFT | To be measured | To be measured | Meets workload-specific targets |
| p95 inter-token latency; throughput | To be measured | To be measured | Meets workload-specific targets |
| Errors and timeouts | To be measured | To be measured | Within service limits |
| Answer quality; retrieval accuracy; tool success rate | To be measured | To be measured | No unacceptable regression |
| Cost per successful request, USD | To be measured | To be measured | Within approved budget |
Roll back when tail latency breaches limits, queues grow, errors spike, quality drops, or costs exceed the budget. Automate rollbacks for reliability breaches. Require human review for quality or cost regressions.
Conclusion: Fix the Measured Bottleneck
Trace the full request and separate app delays from serving pressure before changing models or buying capacity. Streaming alone doesn't reduce compute. High utilization doesn't prove serving is healthy, and higher throughput can worsen tail latency. After every material change, retest responsiveness, quality, cost, and p95/p99 against the workload targets.
FAQs
How can I diagnose latency without provider telemetry?
Monitor your entire application stack. Use custom logs and timestamps to measure network transit, retrieval, model queuing, inference, and tool execution wherever you have visibility.
Use Xcode Instruments or Android Studio Profiler to check app performance and find bottlenecks in network calls and API operations. Keep compute resources close to your data to help reduce transfer delays.
What latency targets should I set for my AI app?
Target load times under 2 seconds and API response times under 200 ms at AI workflow integration points. For app startup, aim for under 2 seconds for cold starts, under 1 second for warm starts, and under 0.5 seconds for hot starts.
Track performance in real time and move heavy tasks off the main thread. Consider edge inference where it makes sense, and test integration points during sprint planning.
How many requests do I need to measure p99 reliably?
There’s no universal request count for measuring p99 latency reliably. Since p99 measures the far end of the latency distribution, it usually needs more samples than the mean or median.
Collect enough requests for your tail-latency measurement to settle instead of shifting with isolated noise. That gives you a more reliable basis for finding bottlenecks in retrieval and inference chains.
More from the studio